
Imaging Rig Development For Uniform Coral Nub Lighting
Imaging Rig Development
In this notebook post, I will go over the evolution of my imaging rig for coral color image analysis. The objective of the design for this imaging rig is to create an environment with uniform, consistent lighting and without any reflections present in the aquarium glass. While the images being used in this post are JPG images, the images used in the analysis were RAW images. The RAW images were first converted into DNG images and then into linear TIFF images for analysis.
Imaging Rig V1: Reflection Troubleshooting
Tank tests with just the camera, the tank, and the color chart. I used fresh water in this test. Issues with reflections in the glass were observed. Adding a dark background behind the camera and minimizing ambient light sources helped reduce unwanted reflections in the glass.
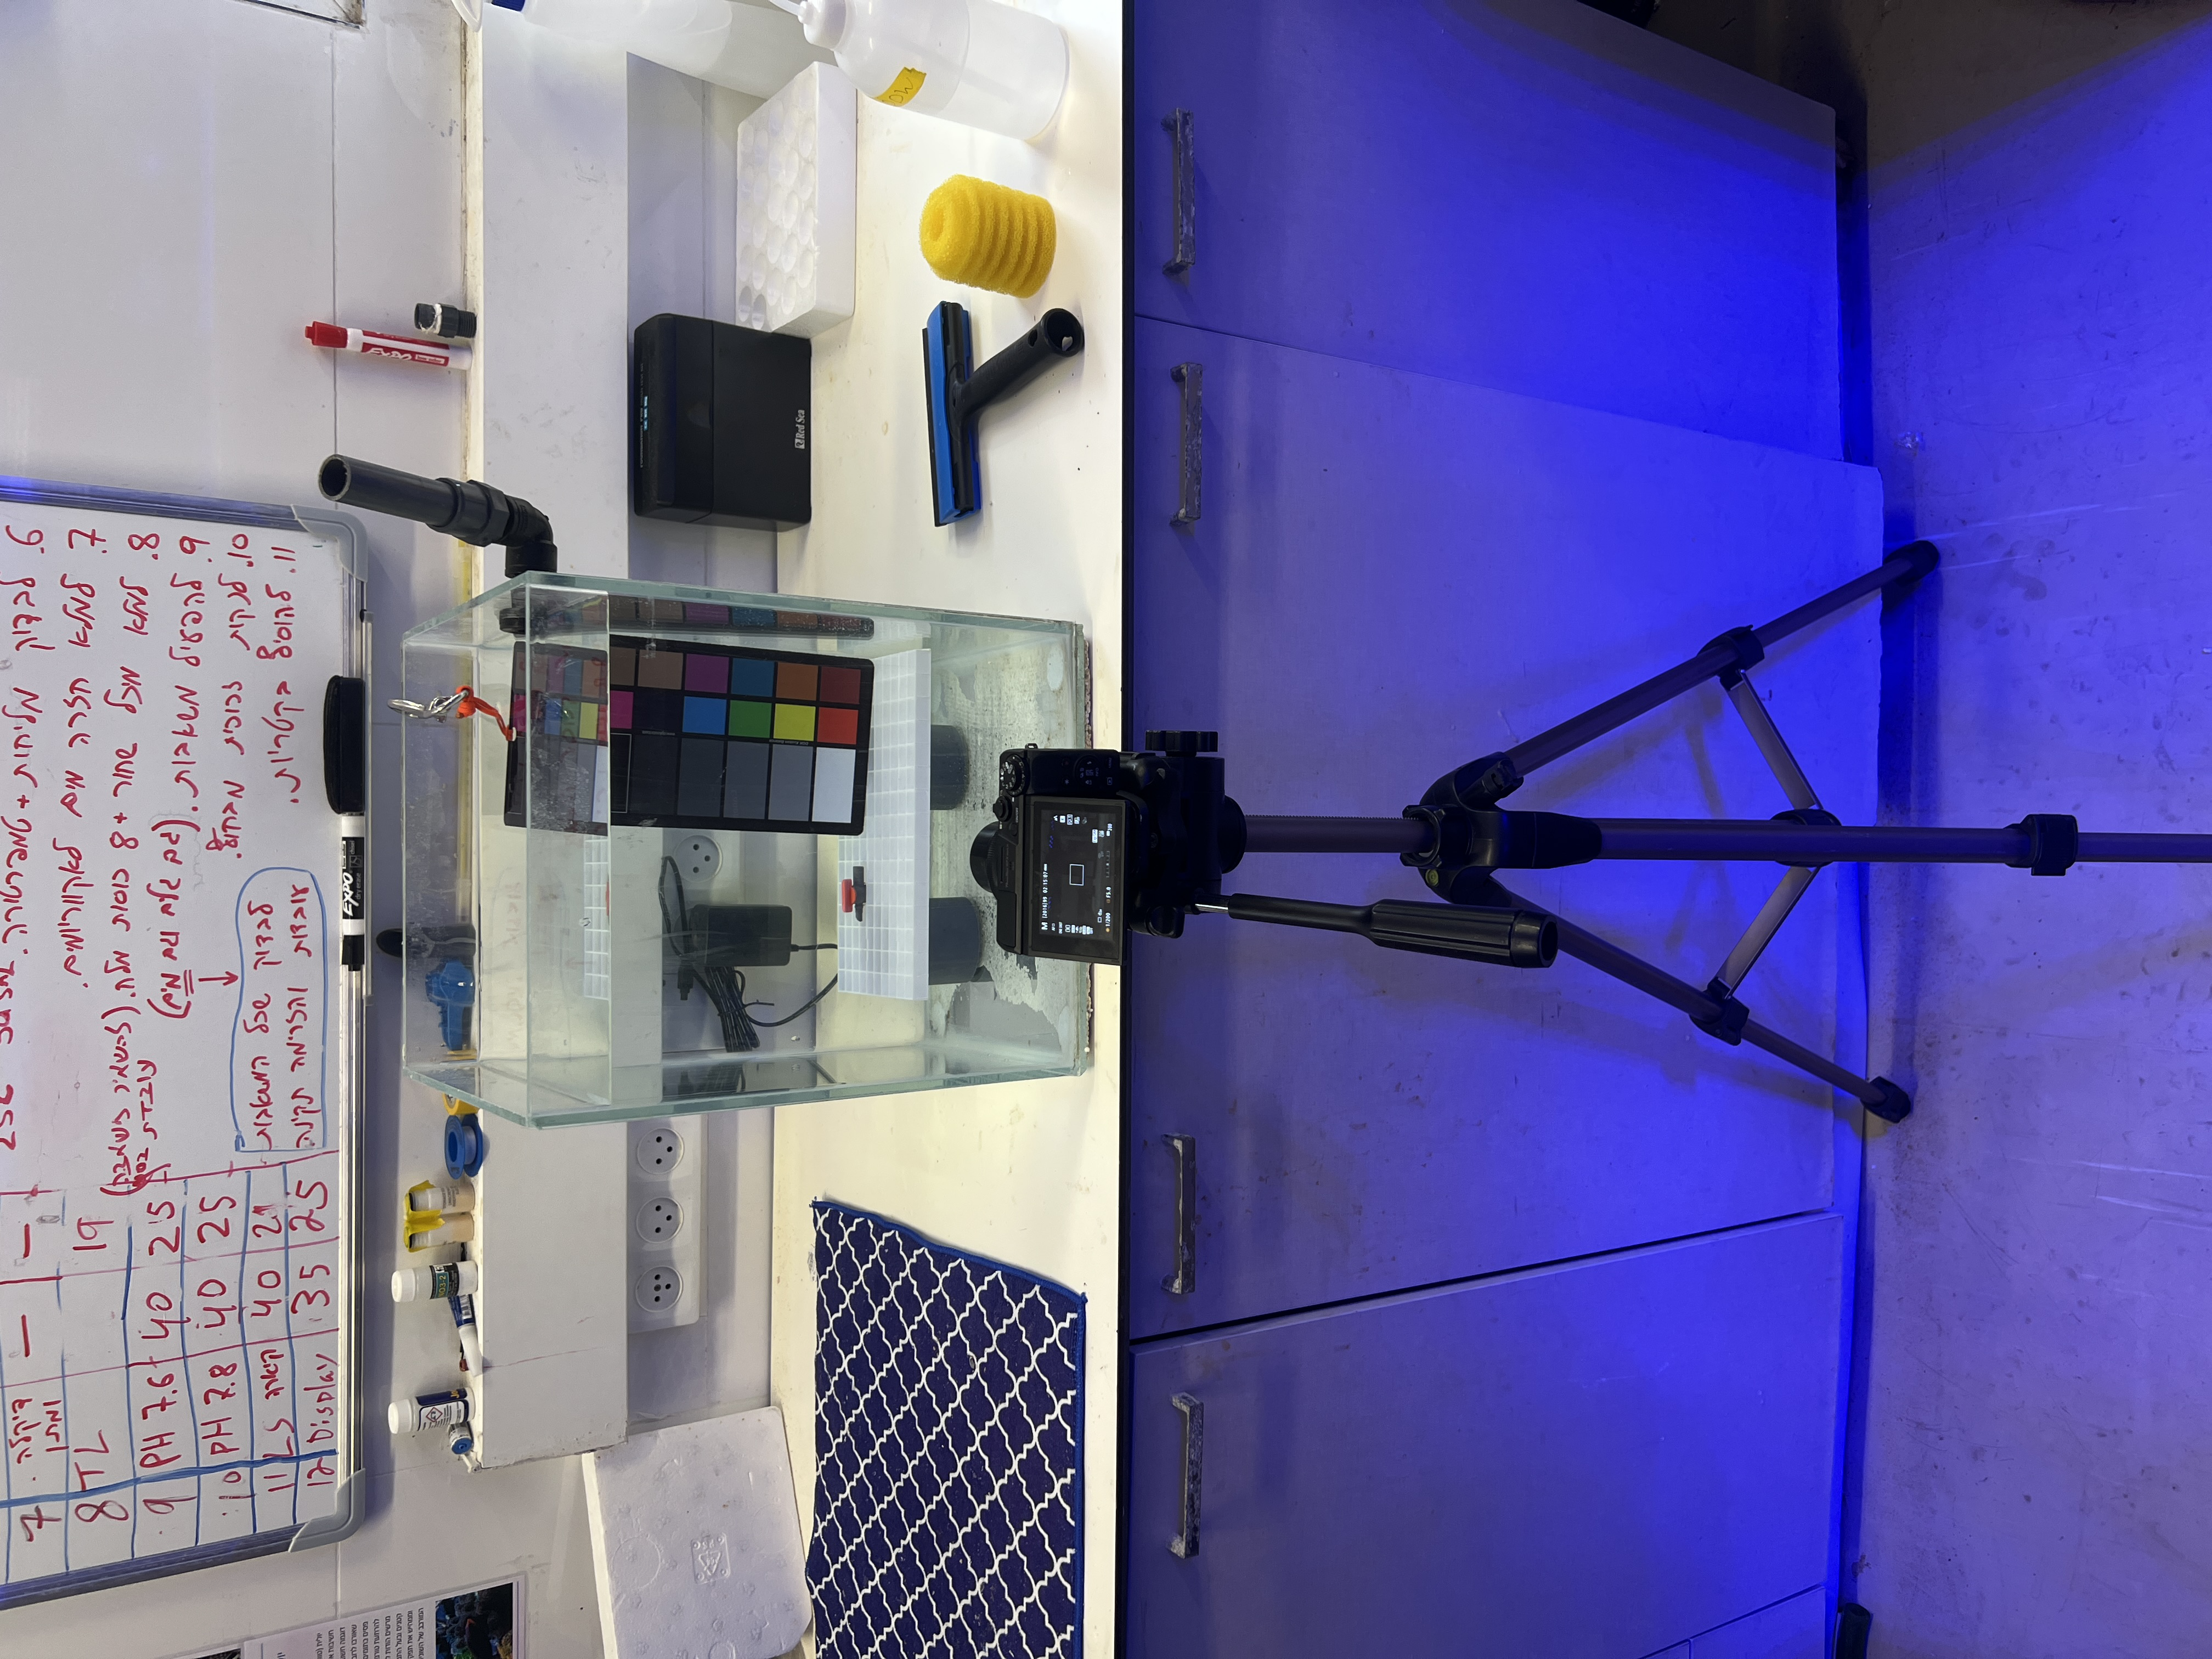 Figure 1: Imaging Rig V1 without backdrop behind camera.
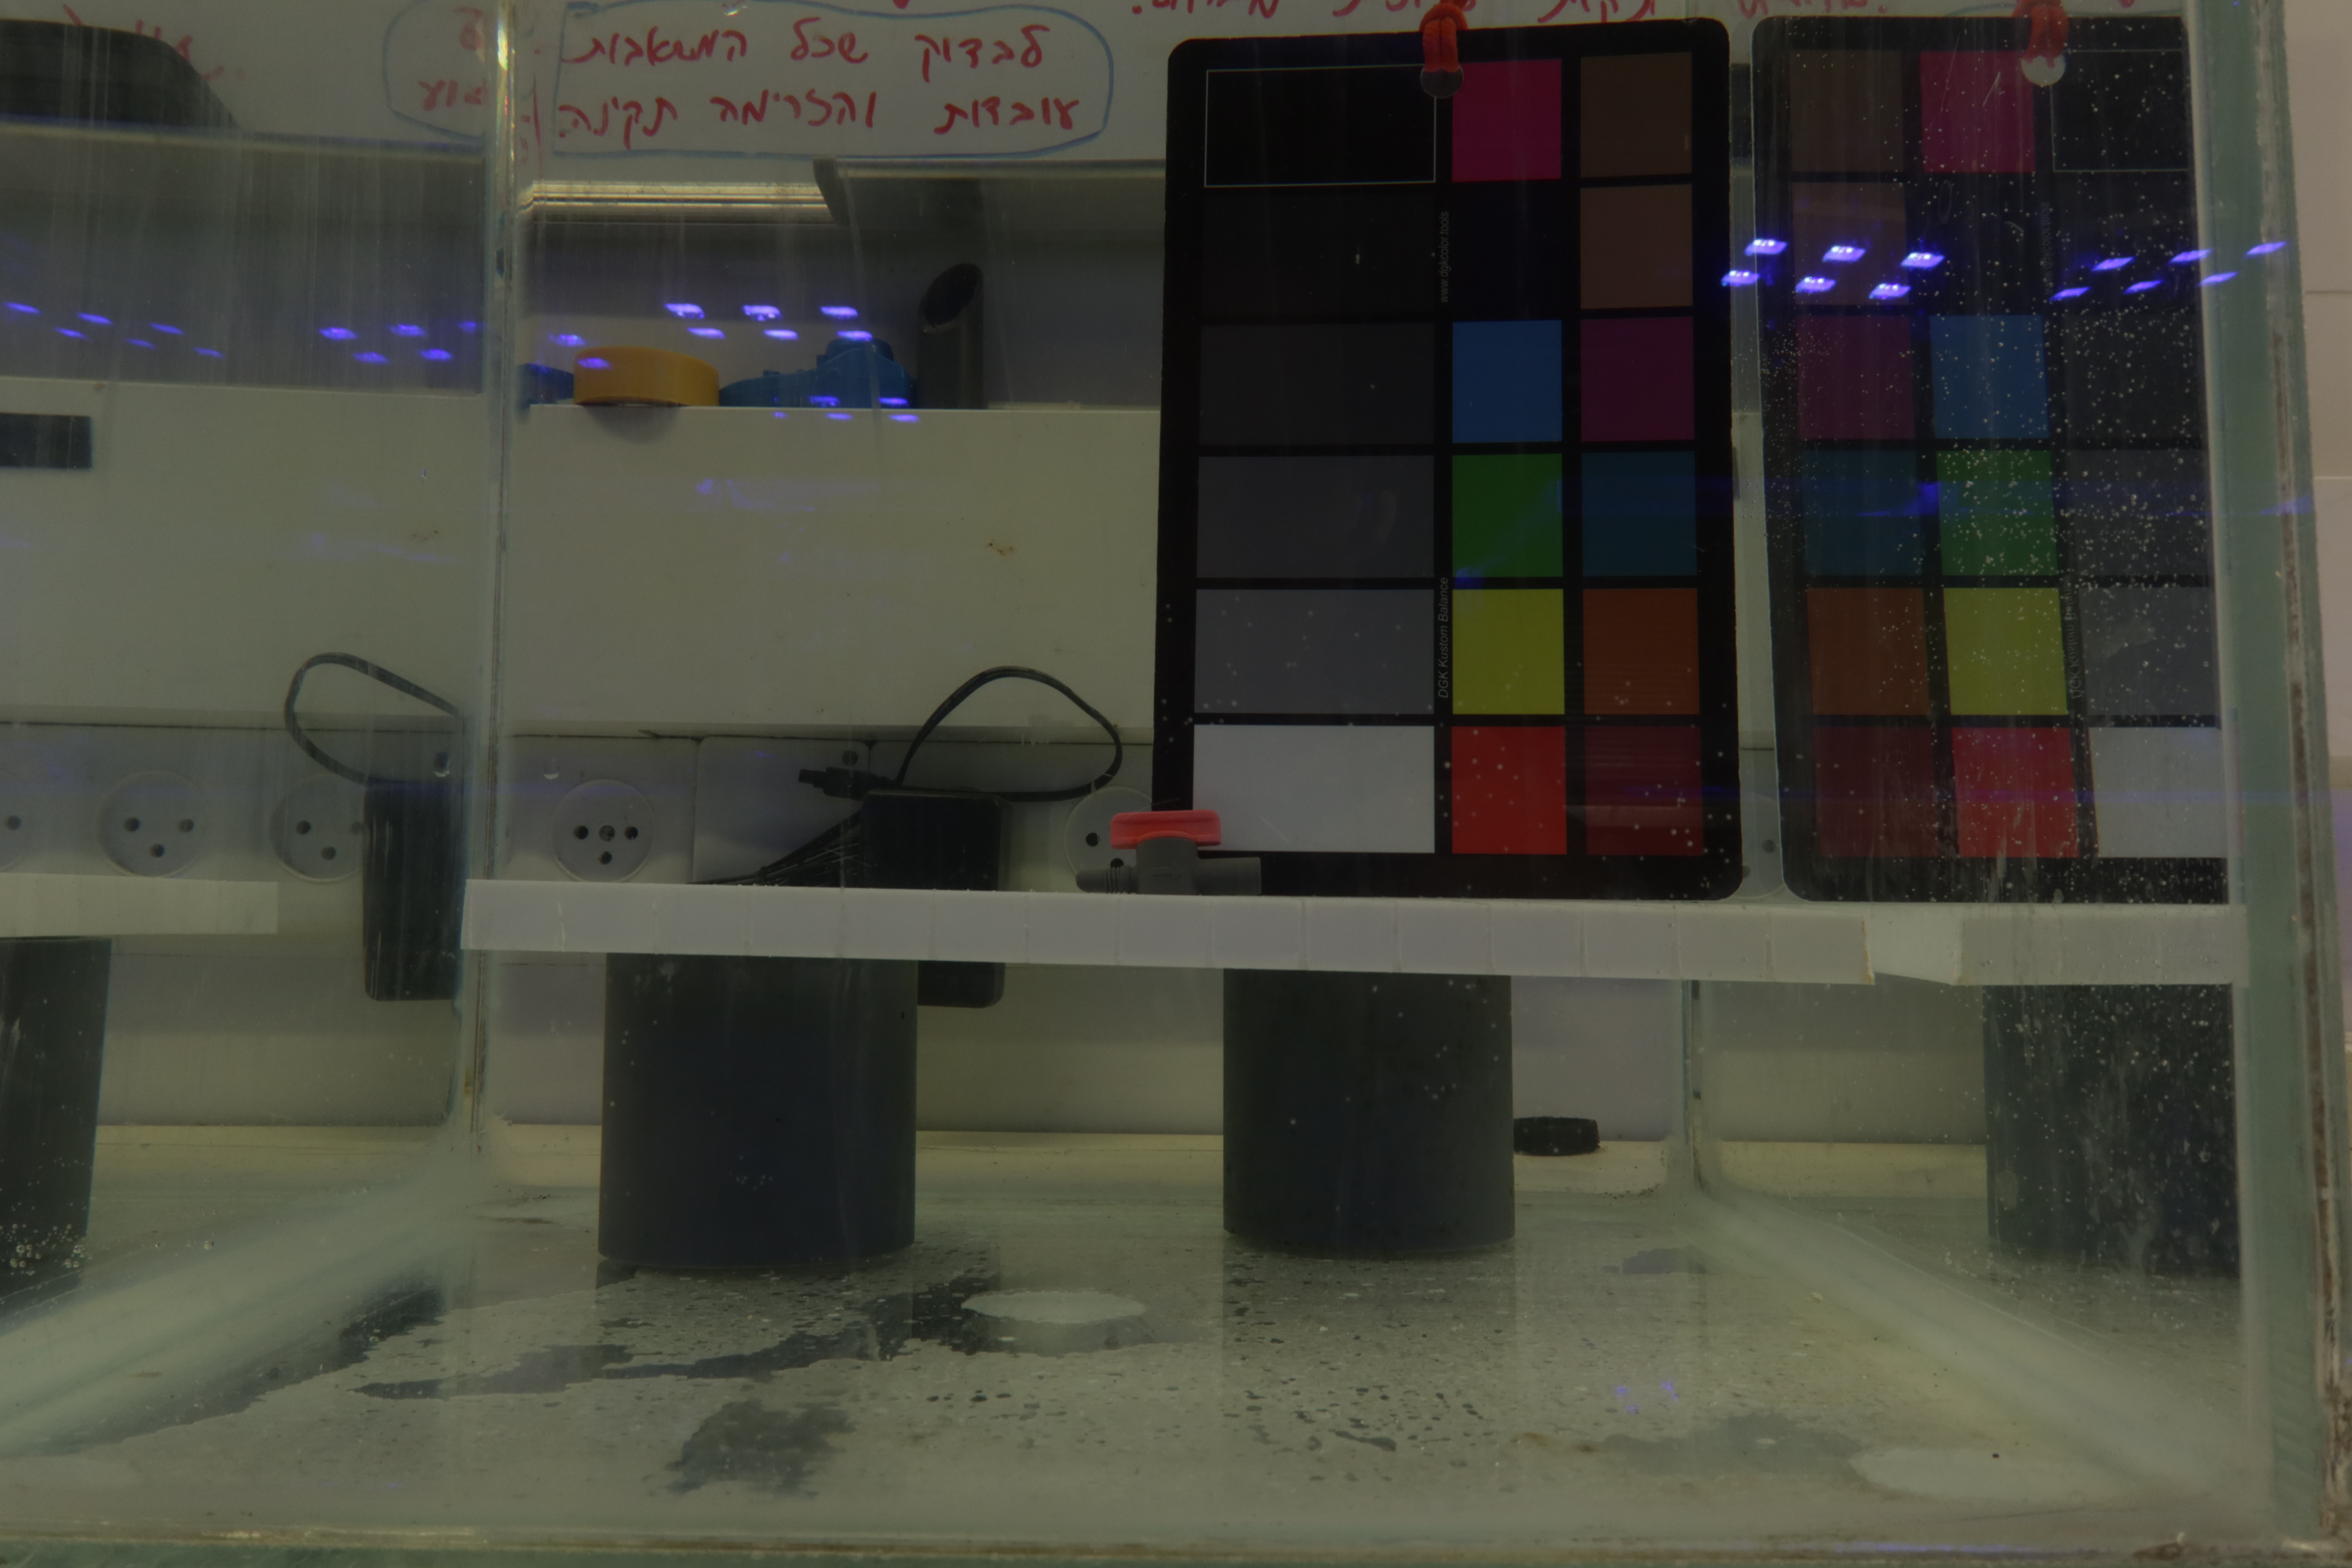 Figure 2: Image output from Imaging Rig V1 without backdrop, notice the reflected lights in the glass.
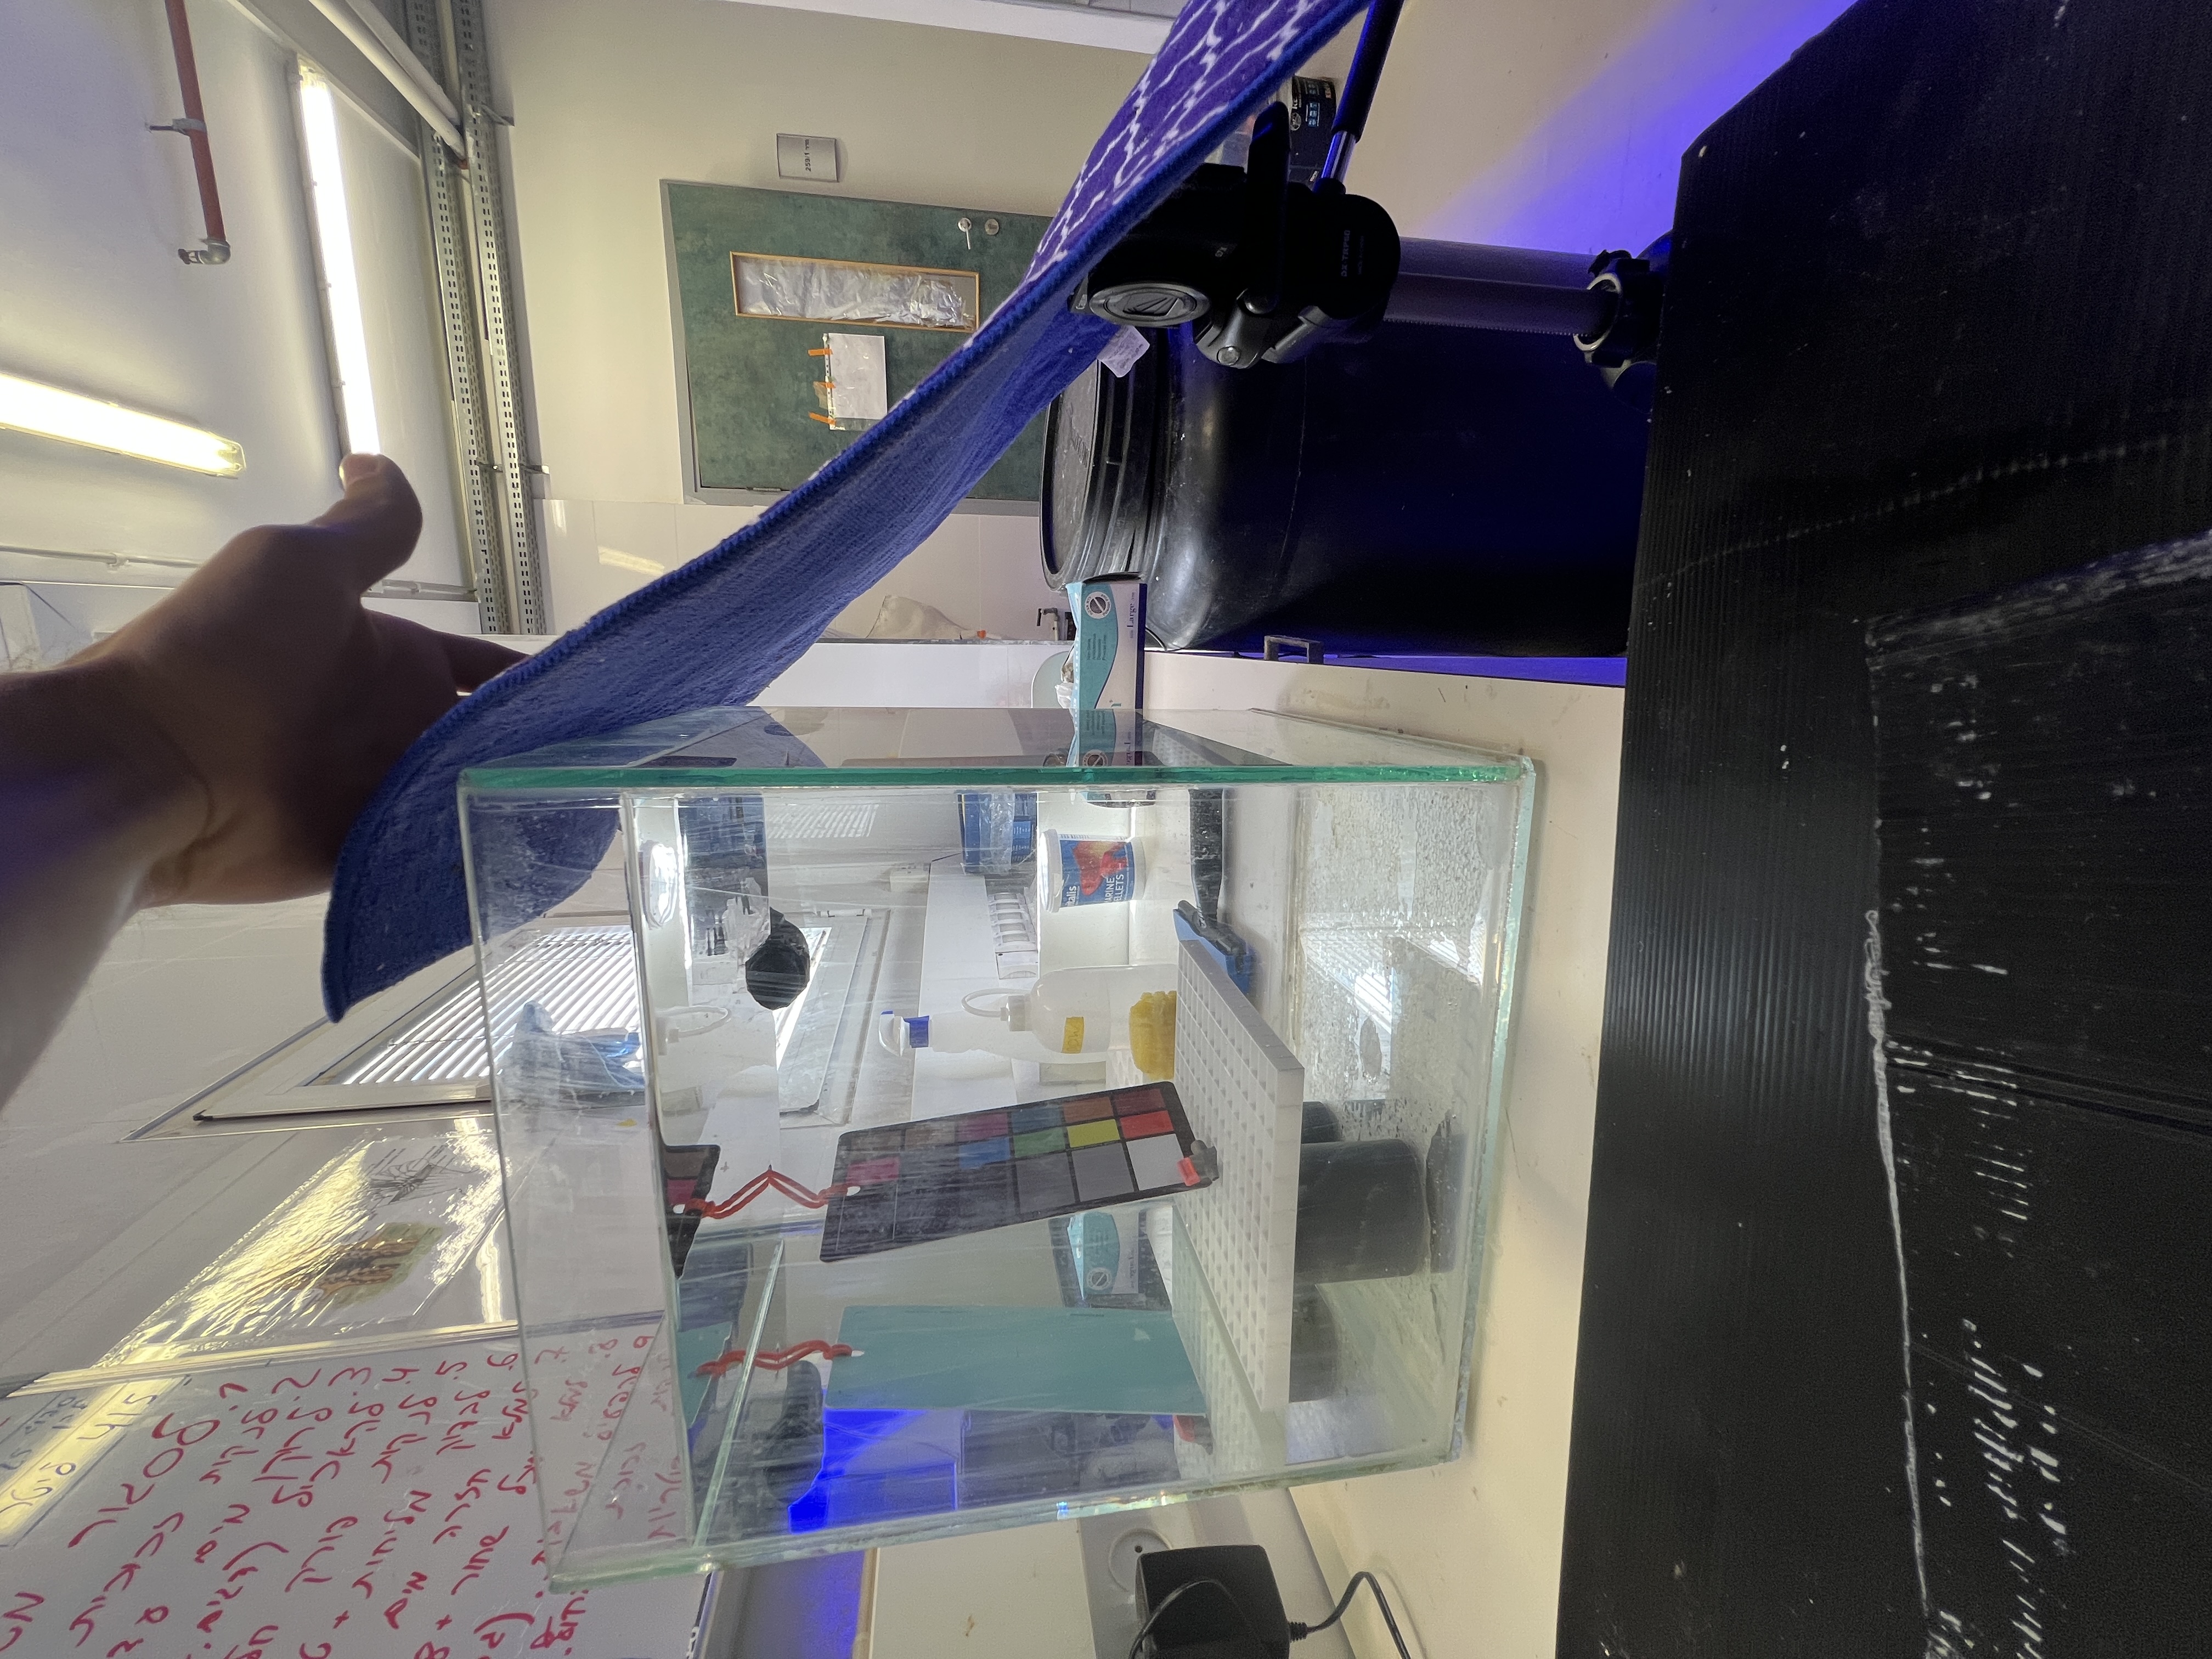 Figure 3: Imaging Rig V1 with backdrop to reduce reflections.
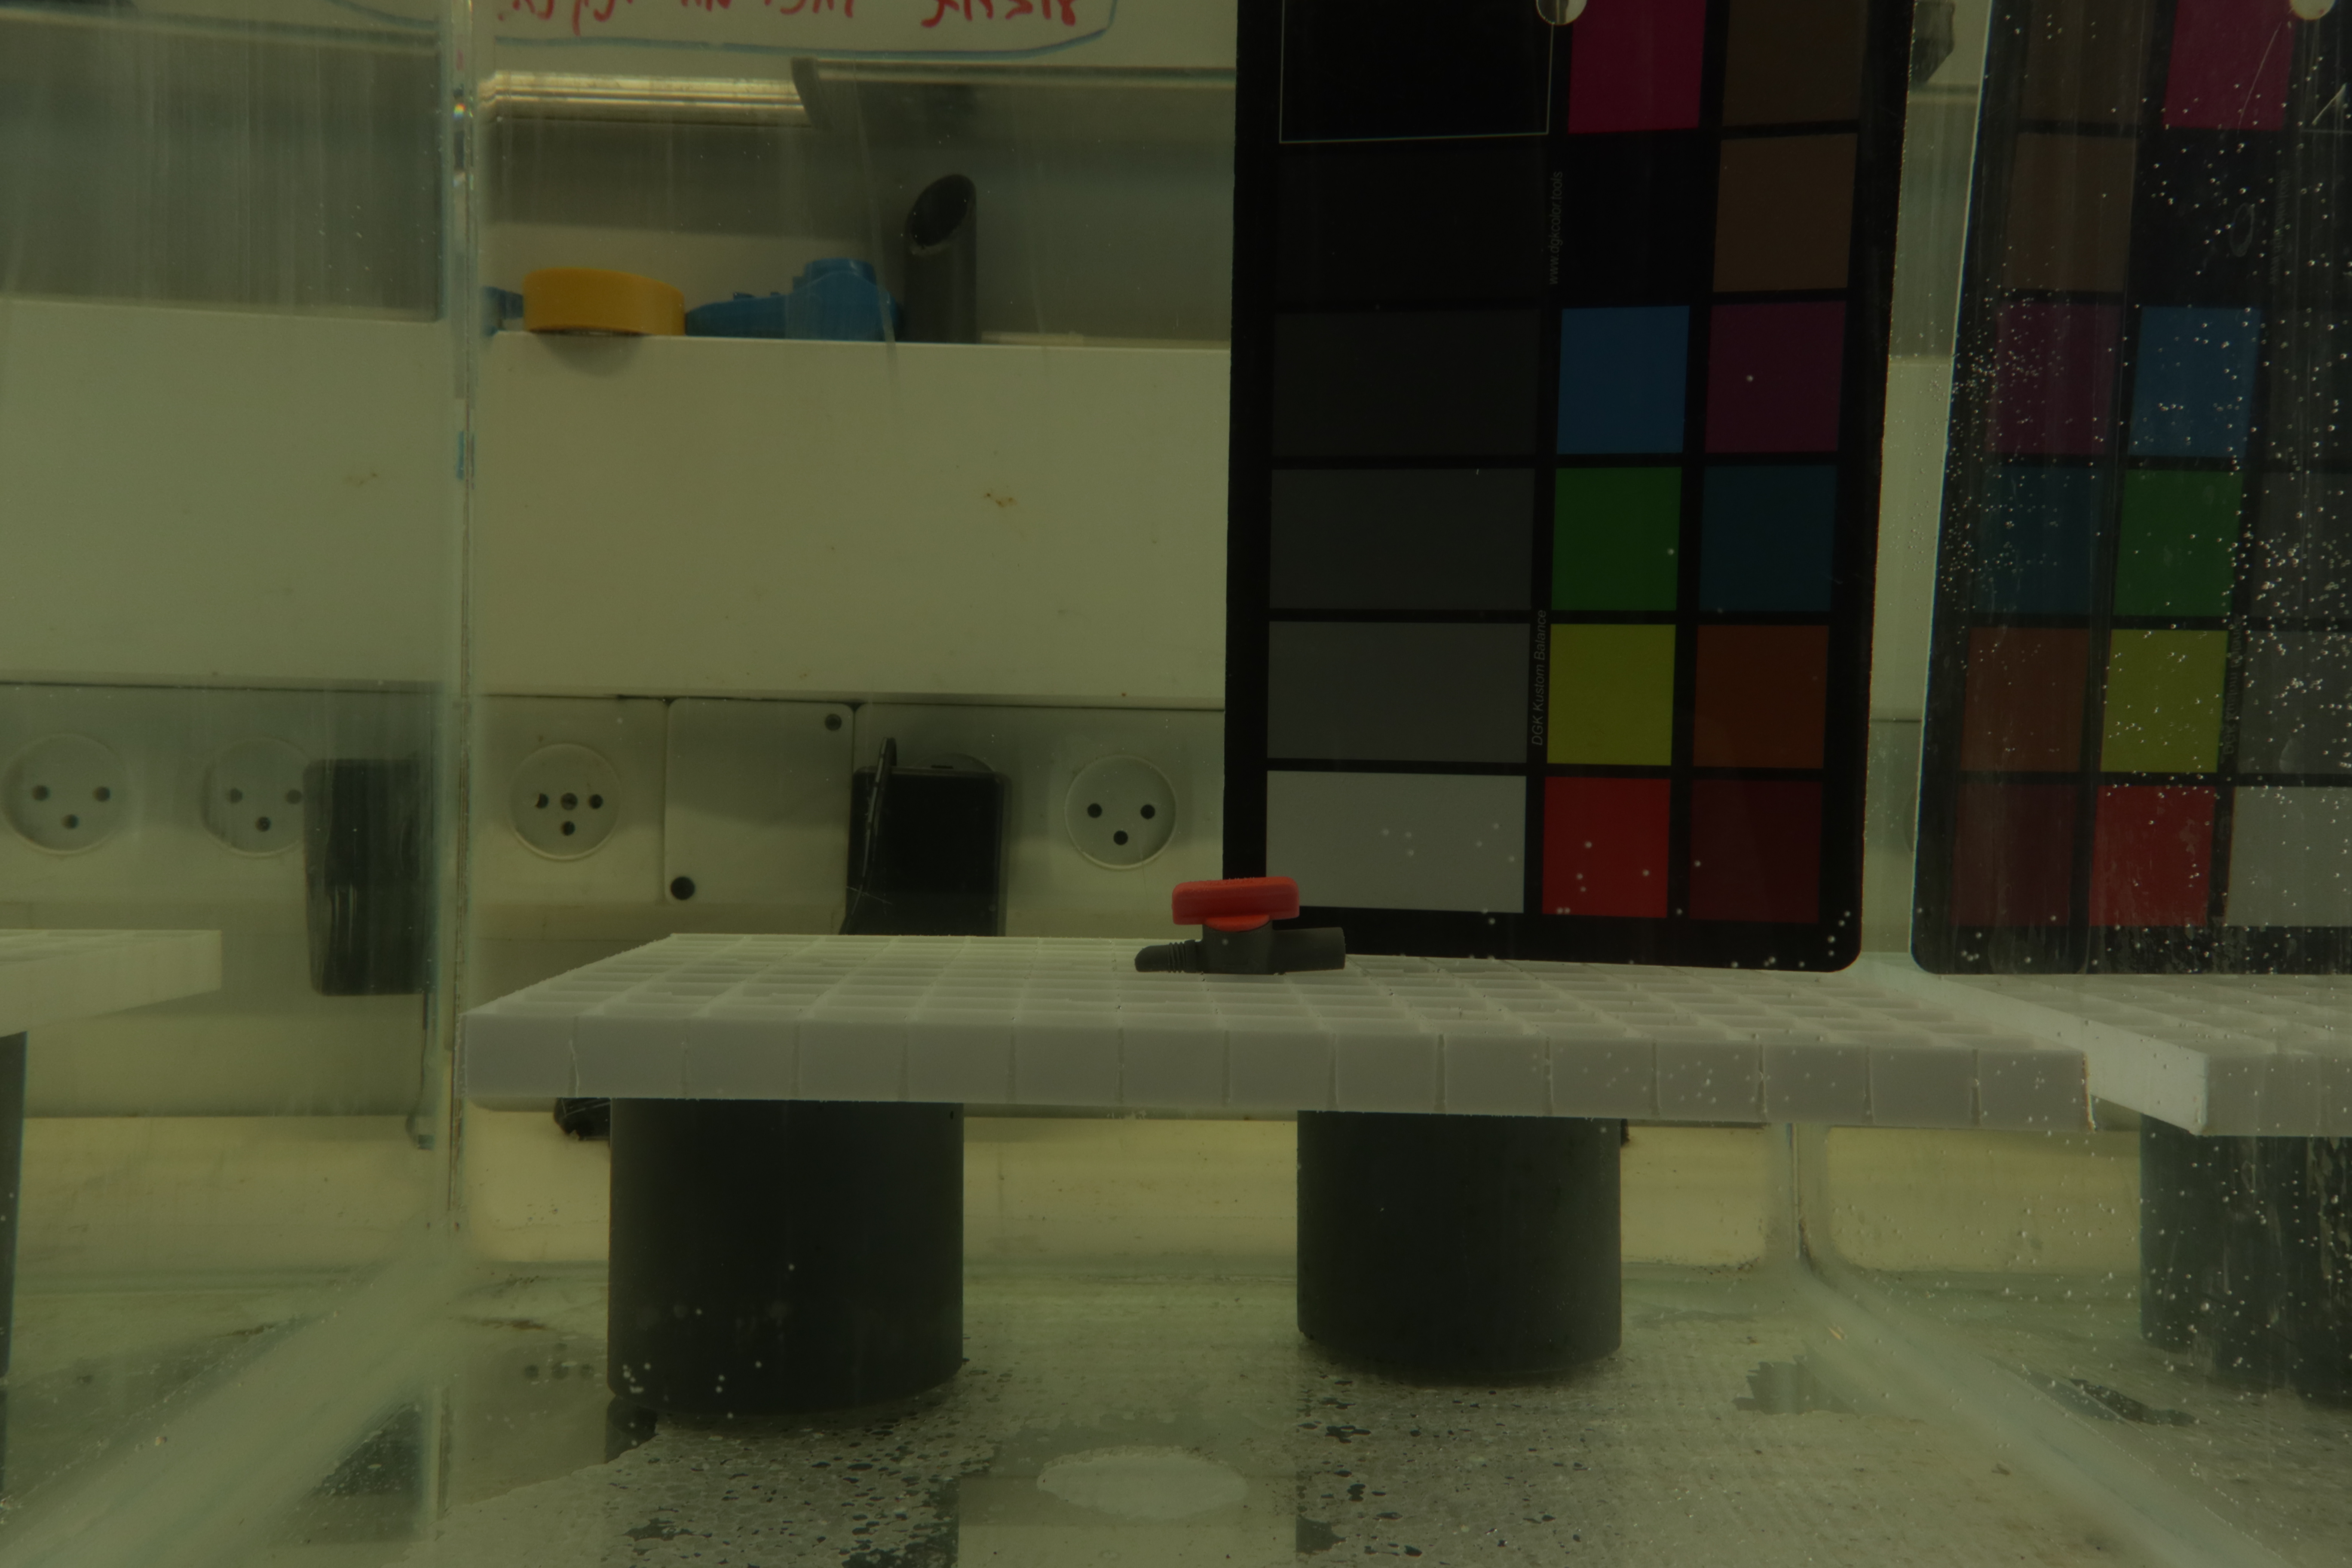 Figure 4: Image output from Imaging Rig V1 with a backdrop behind the camera, notice the reduction of reflected lights in the glass.
Imaging Rig V2: Strobe/timer testing
With this rig, I tested out using a white background and the camera flash. This time, I used saltwater and the actual coral nubs. The strobe flash was not effective, and issues with reflection were still prevalent. Adding a timer countdown for the image helped avoid the hand reflection being present in the image.
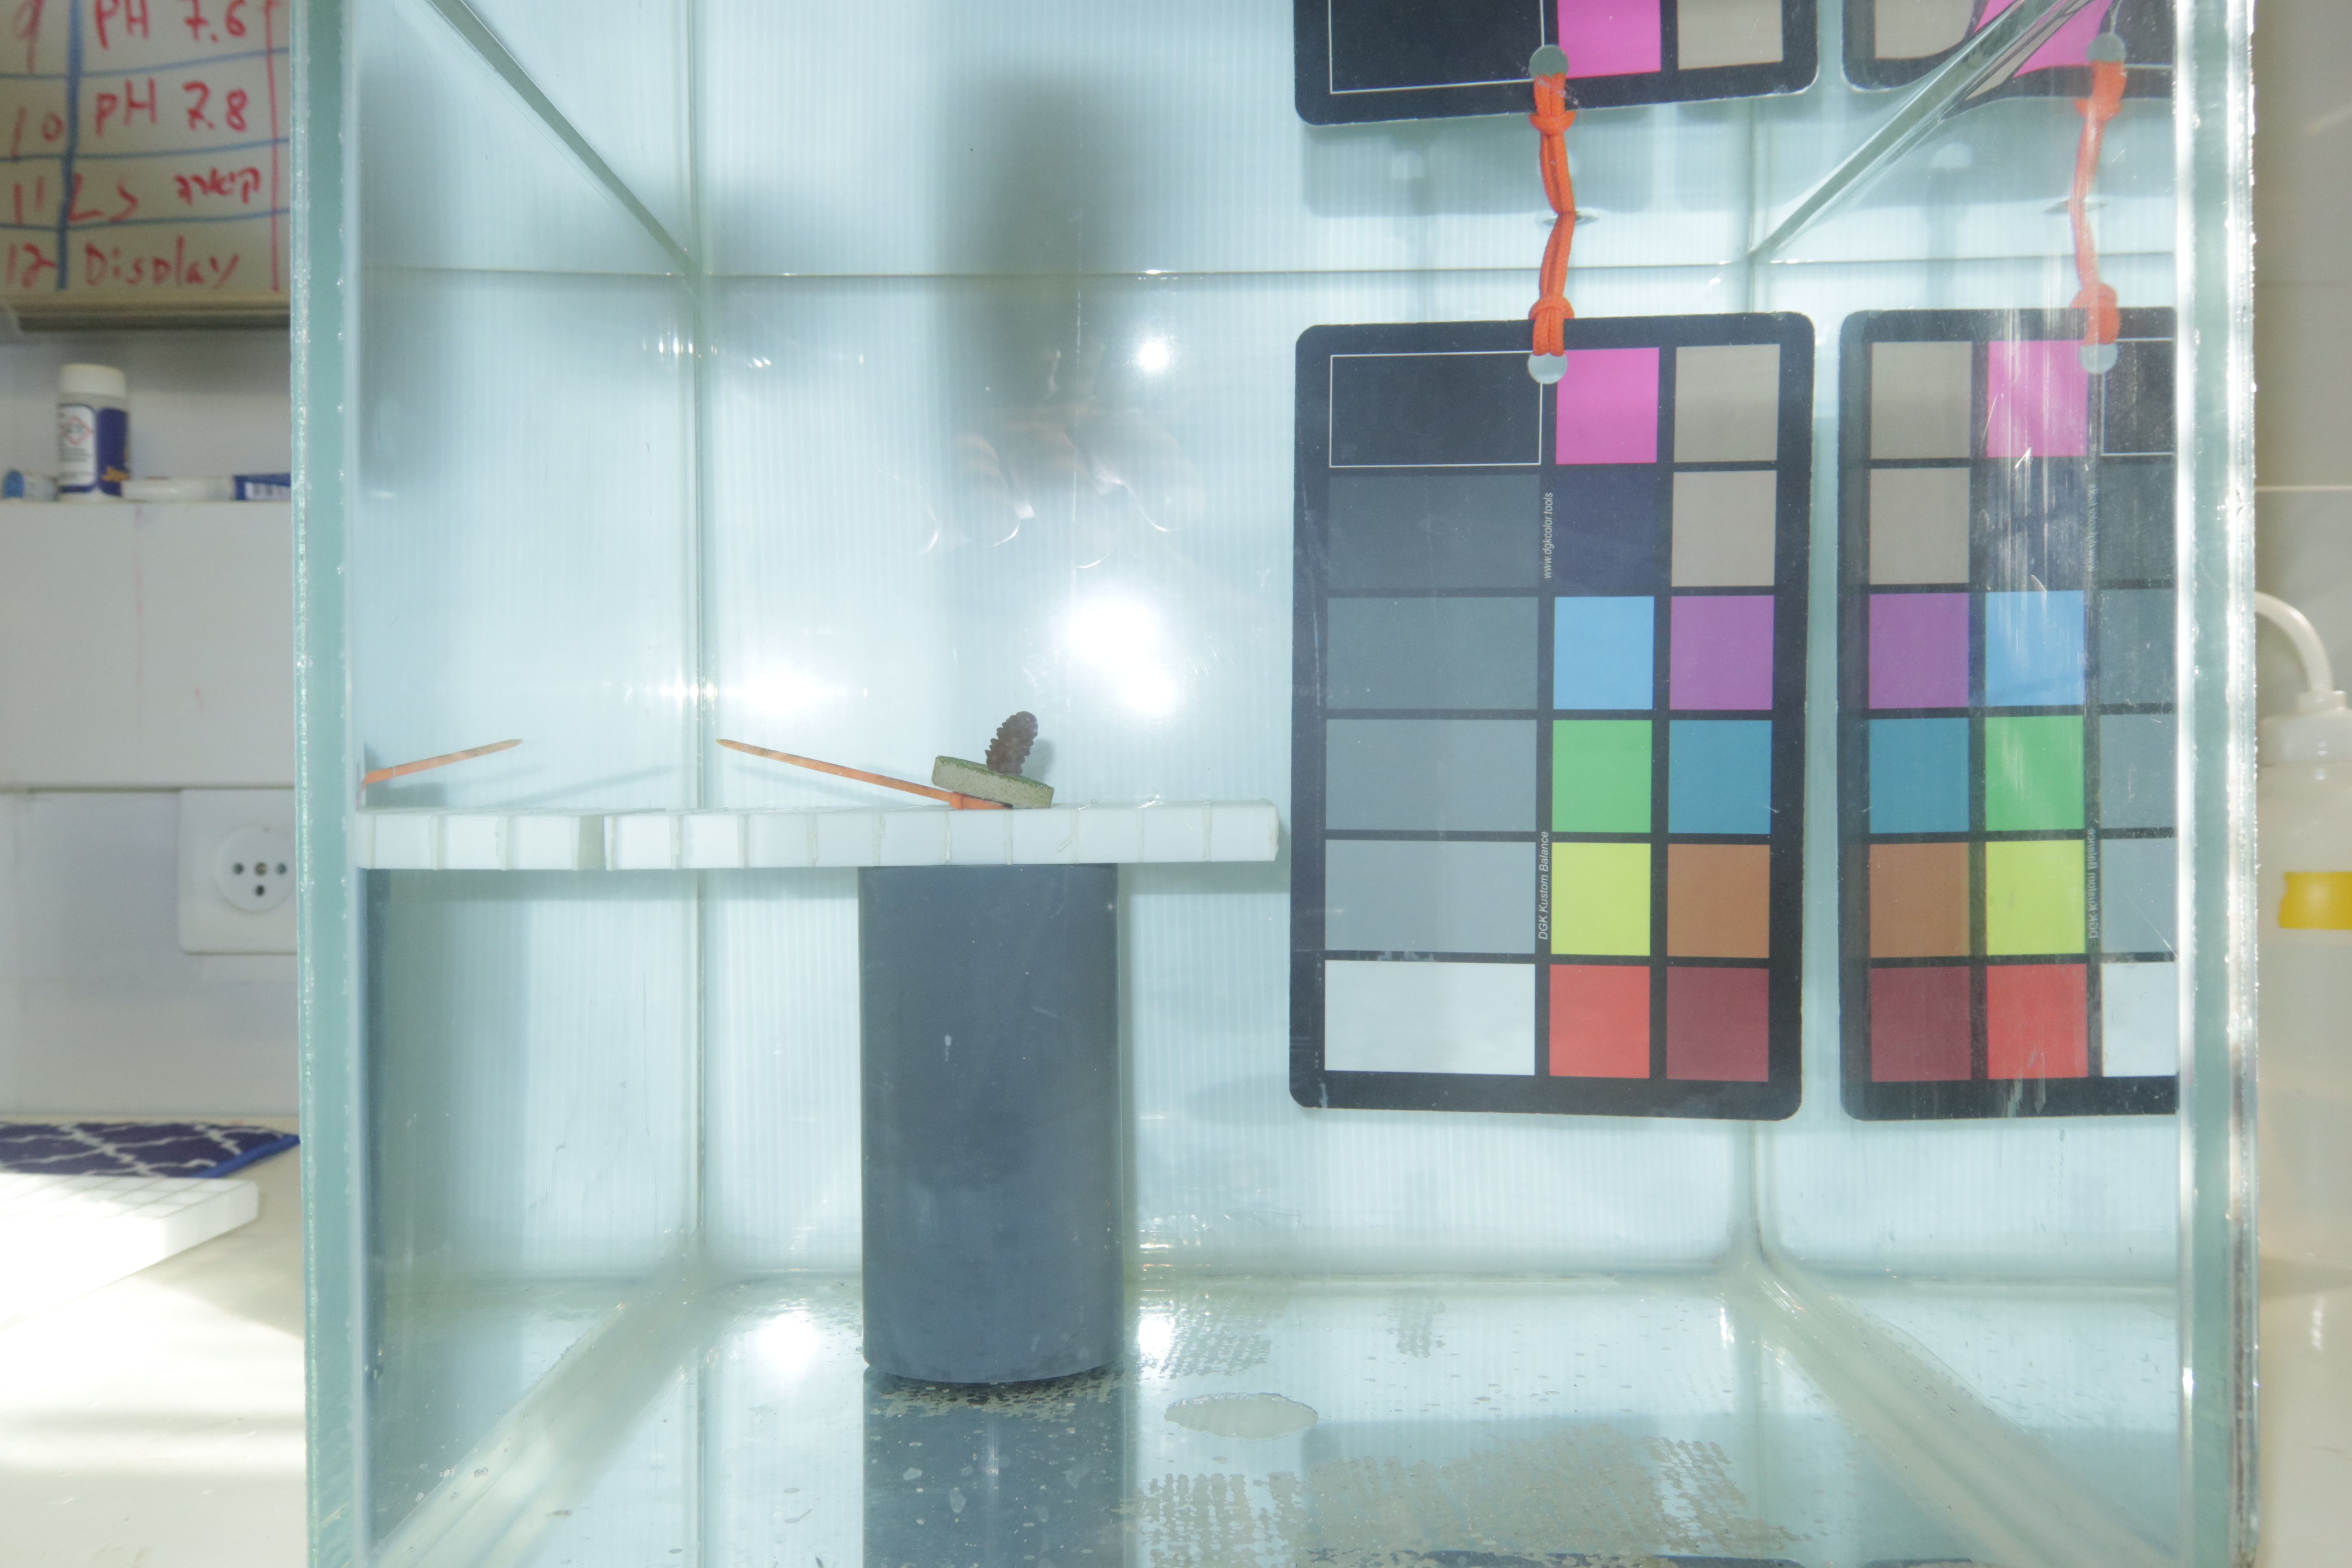 Figure 5: Strobe image.
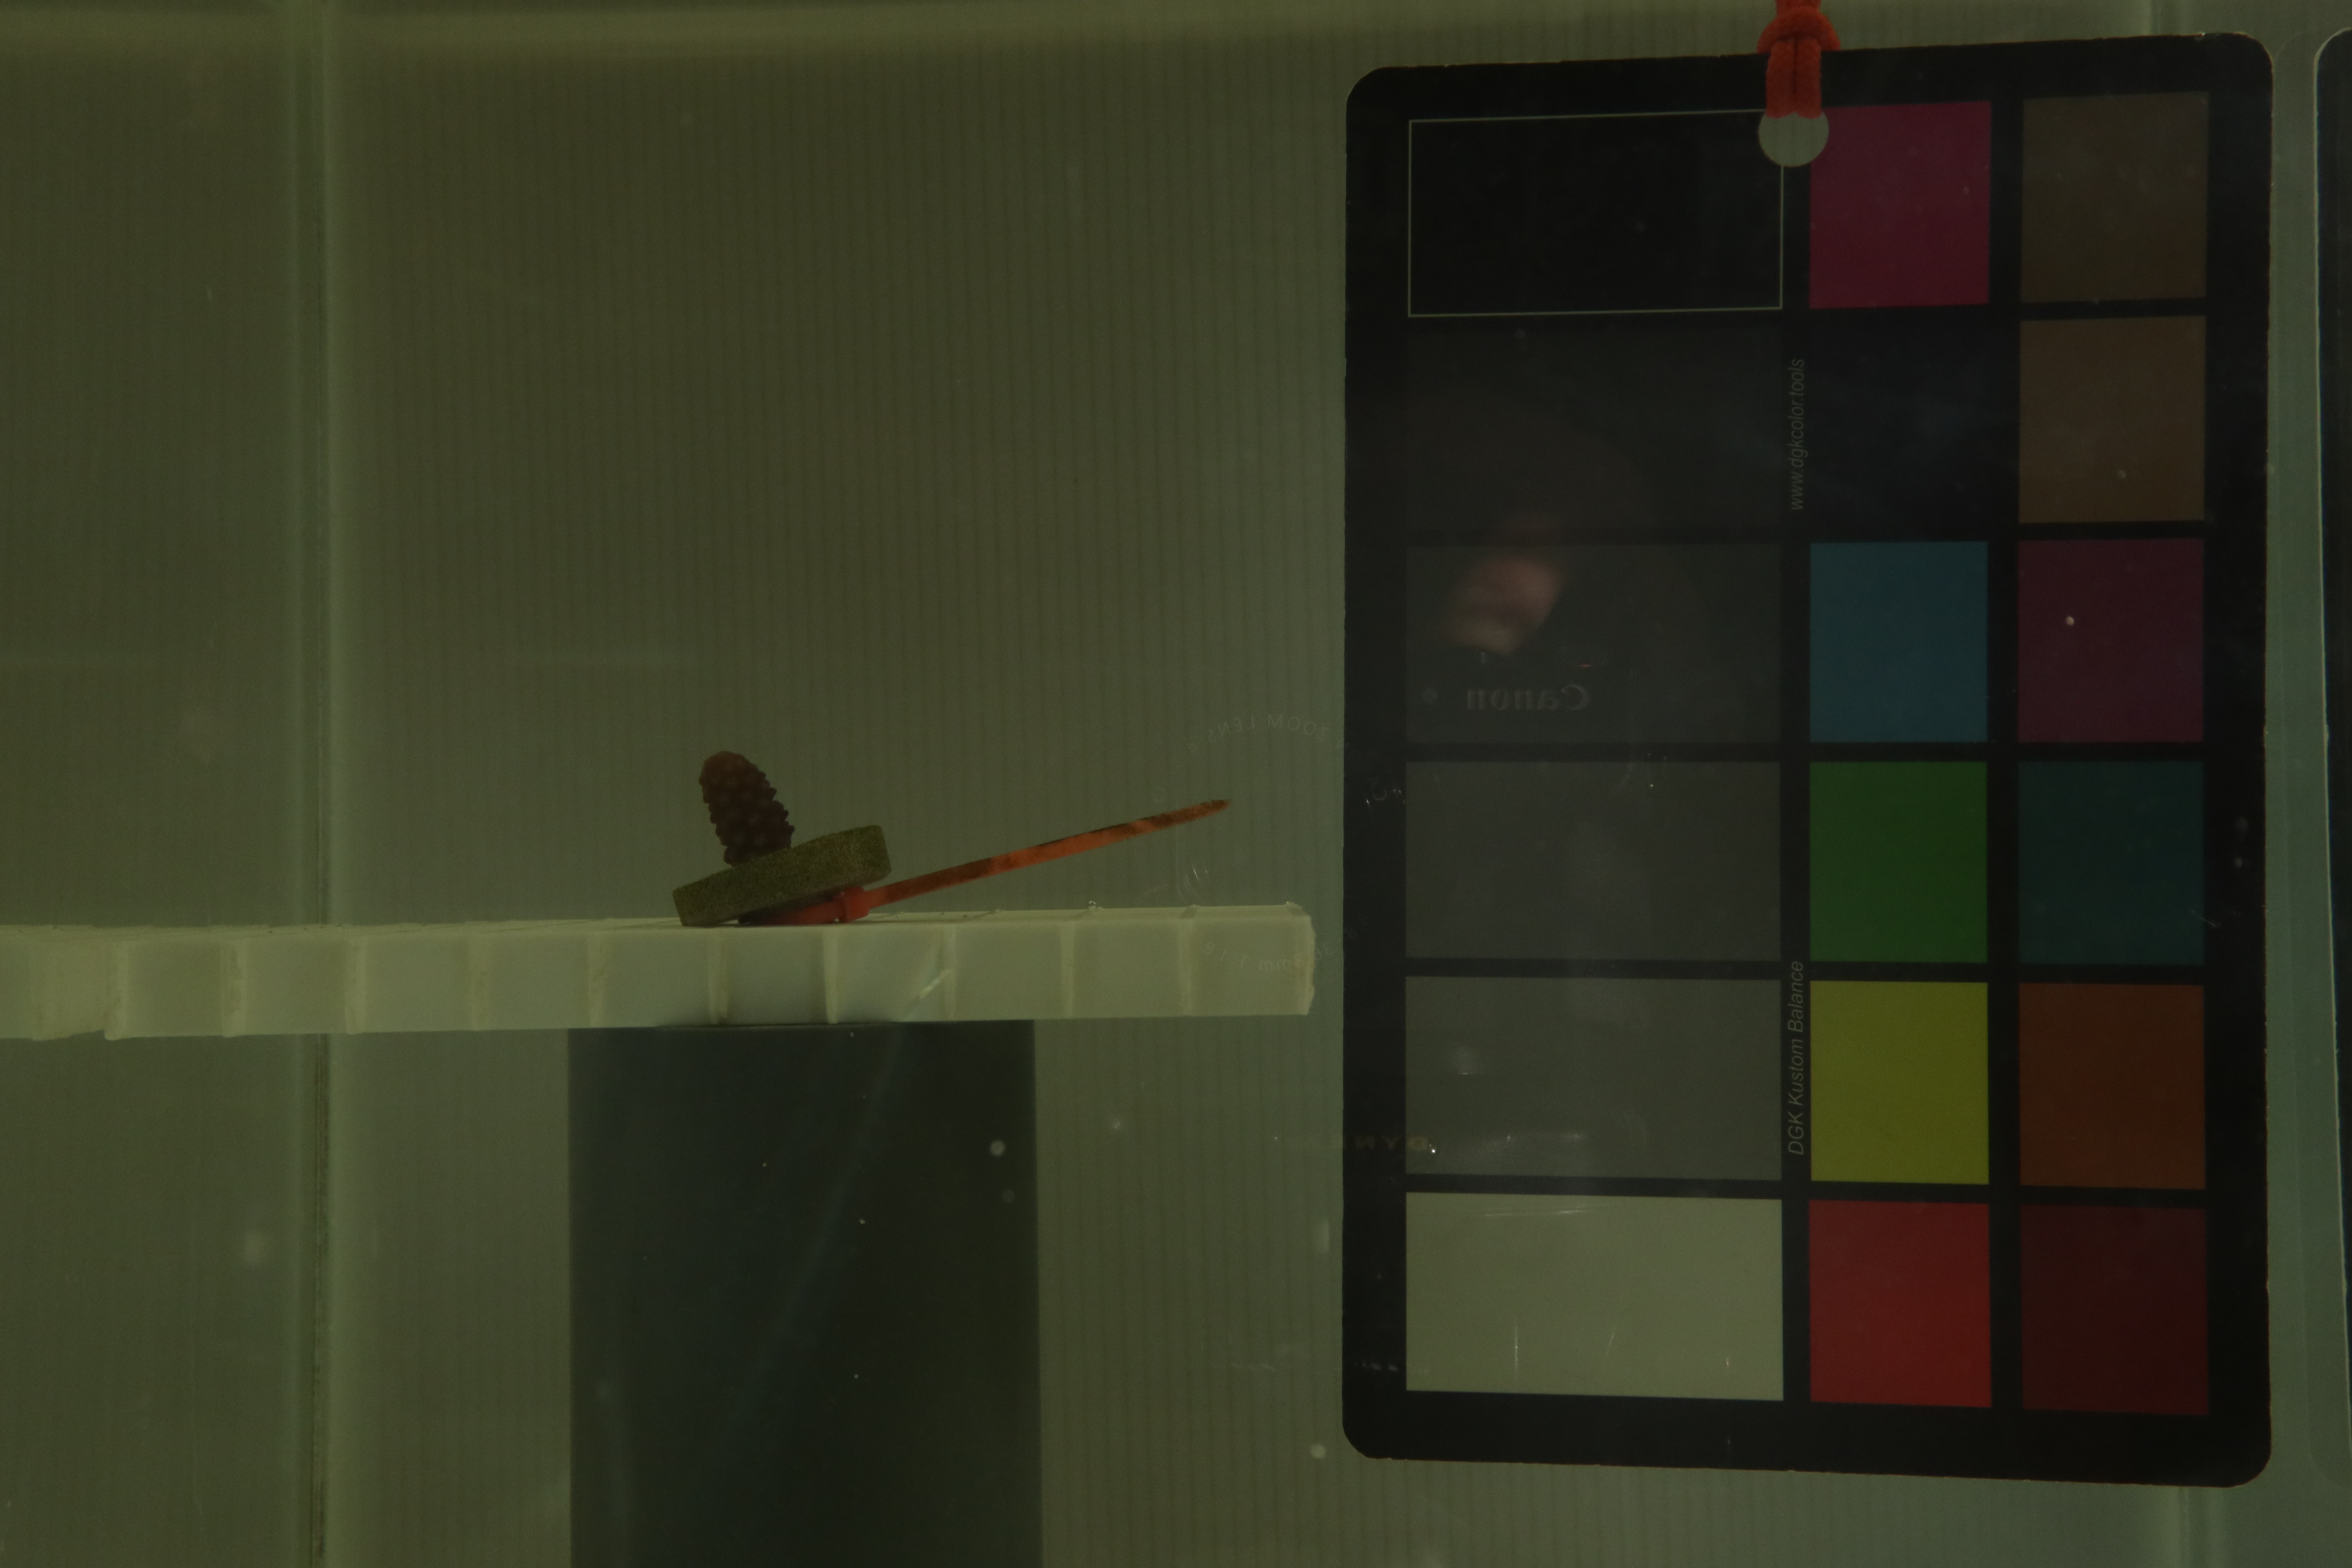 Figure 6: Hand reflection is still noticeable due to ambient light, even with the backdrop.
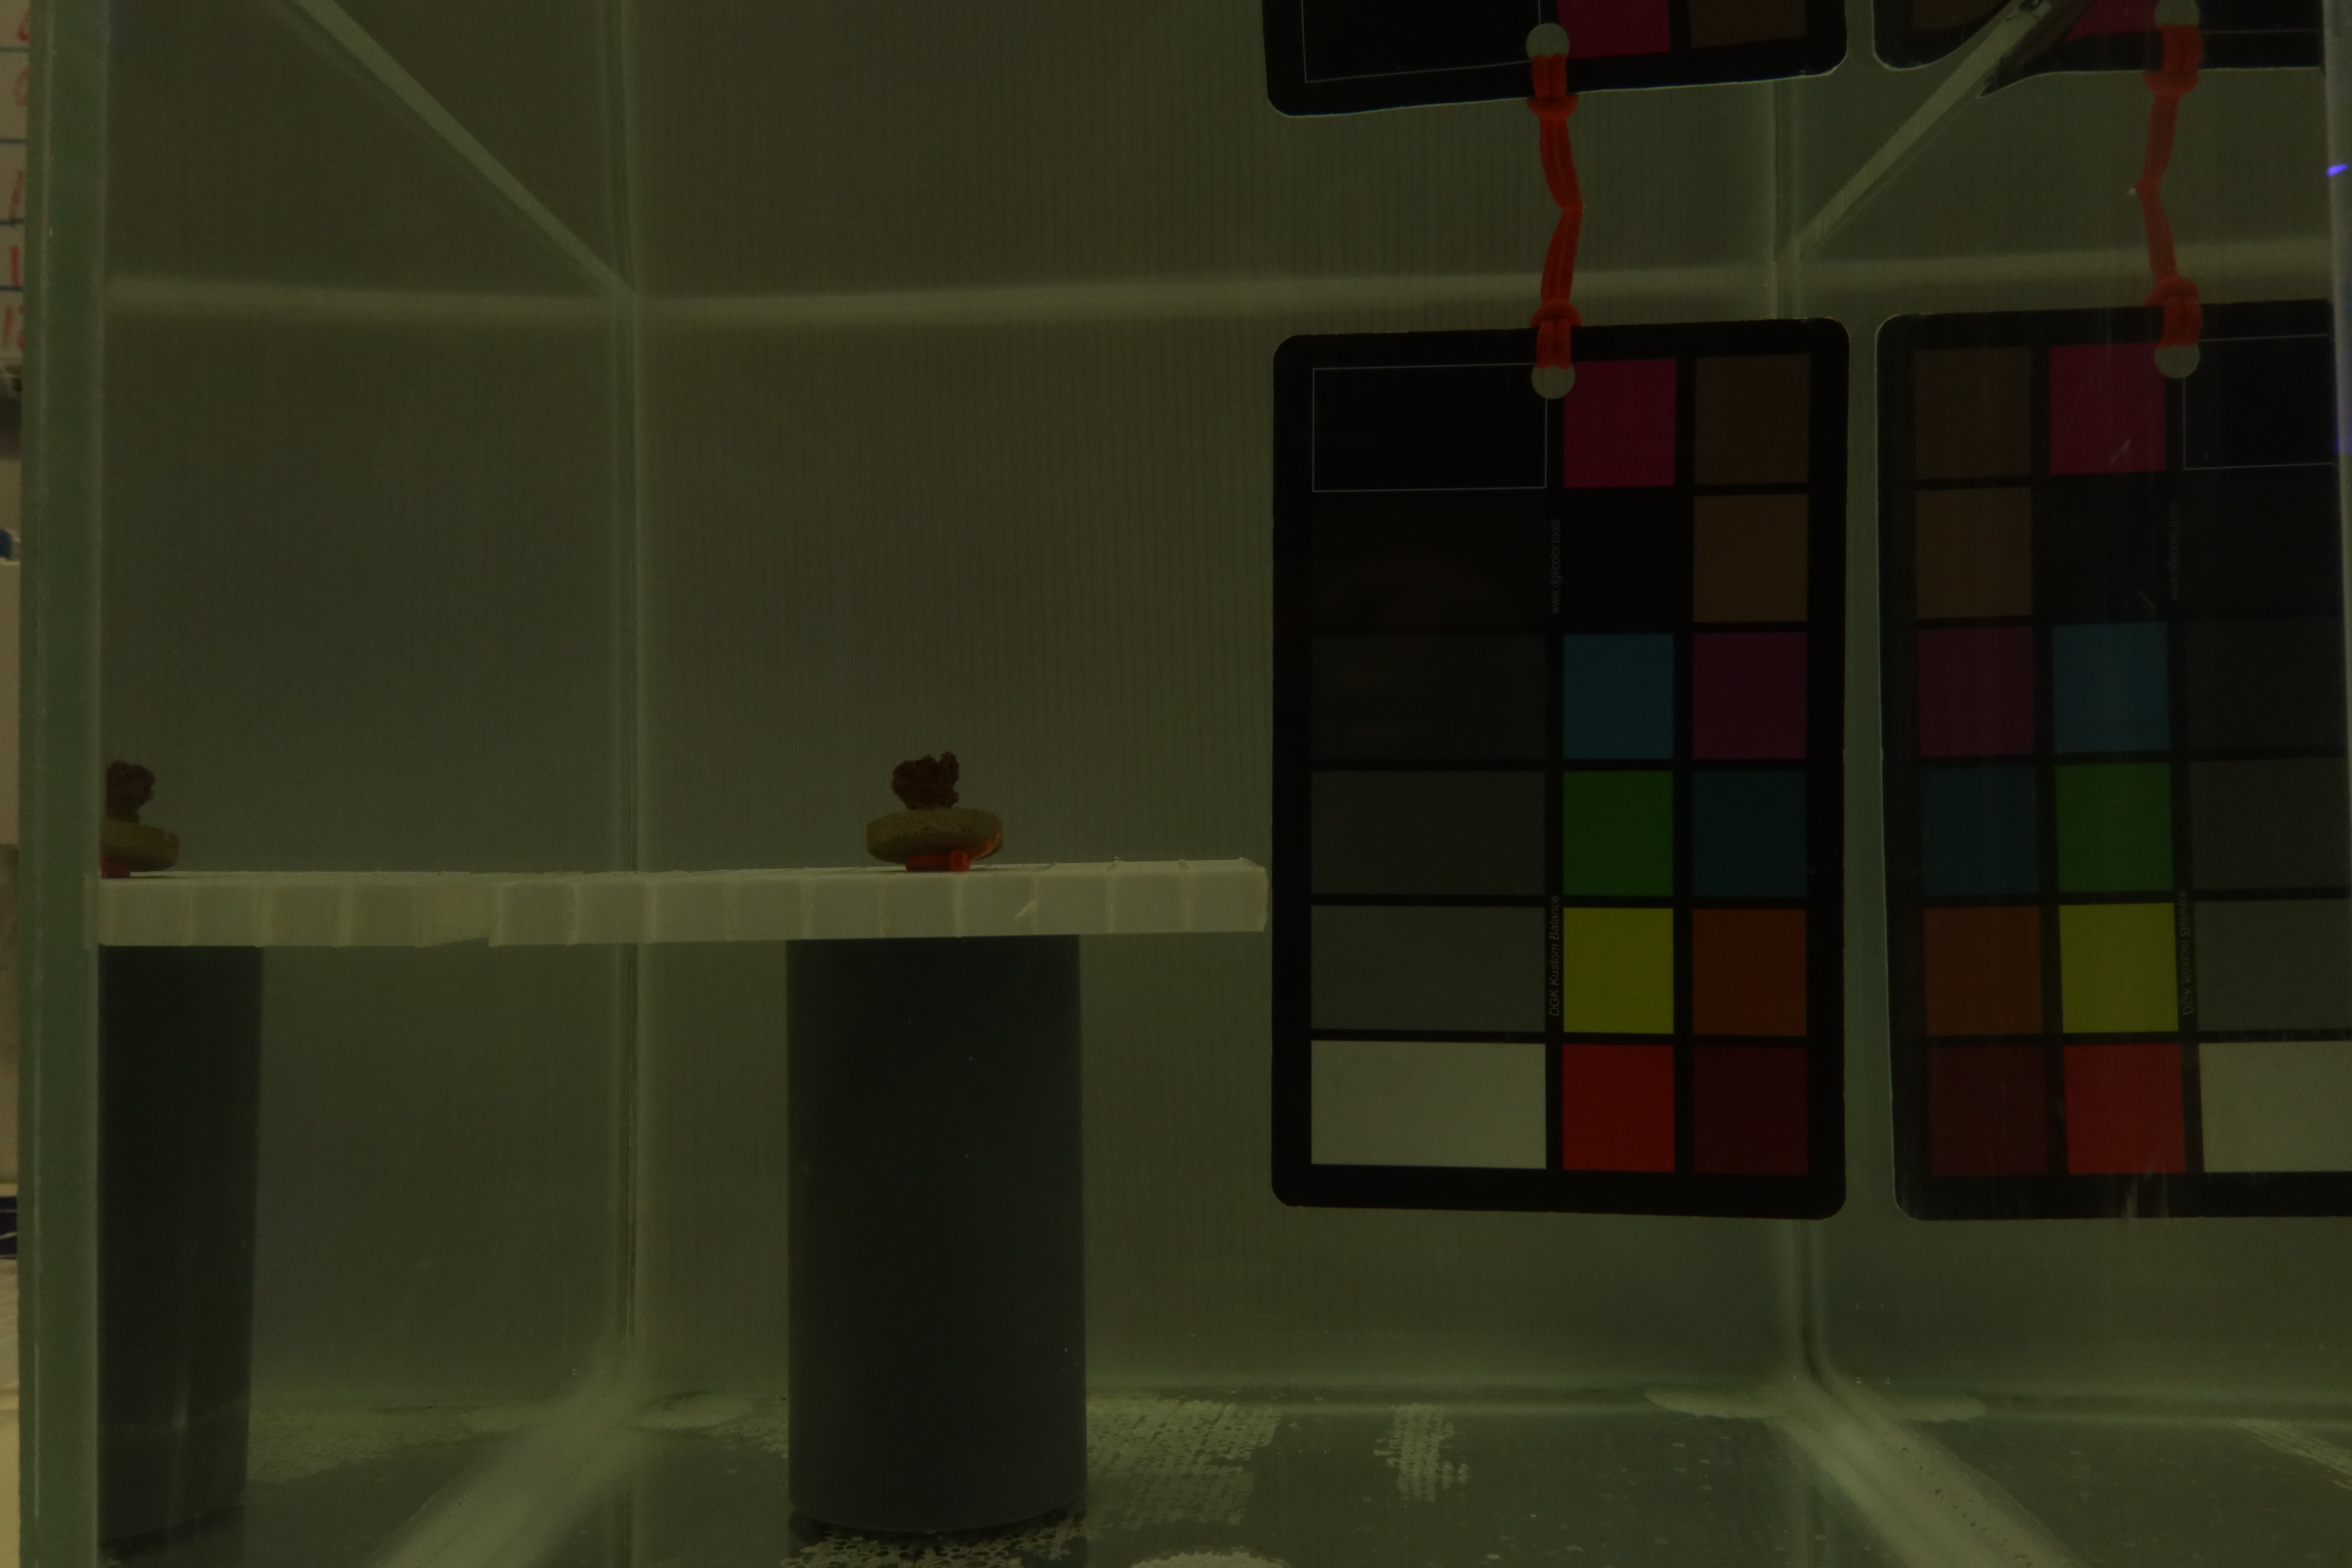 Figure 7: Image taken with a timer to avoid hand reflection. Notice the ziptie tag on the coral causing it to not lie flat.
Imaging Rig V3 - New Equipment Testing
I was provided with access to more imaging gear, which opened up a lot of ways to improve the imaging rig. During this test, I started working with the new Canon EOS 70D camera, the foldable lightbox, and large LED lights. Reflections in the glass still presented an issue.
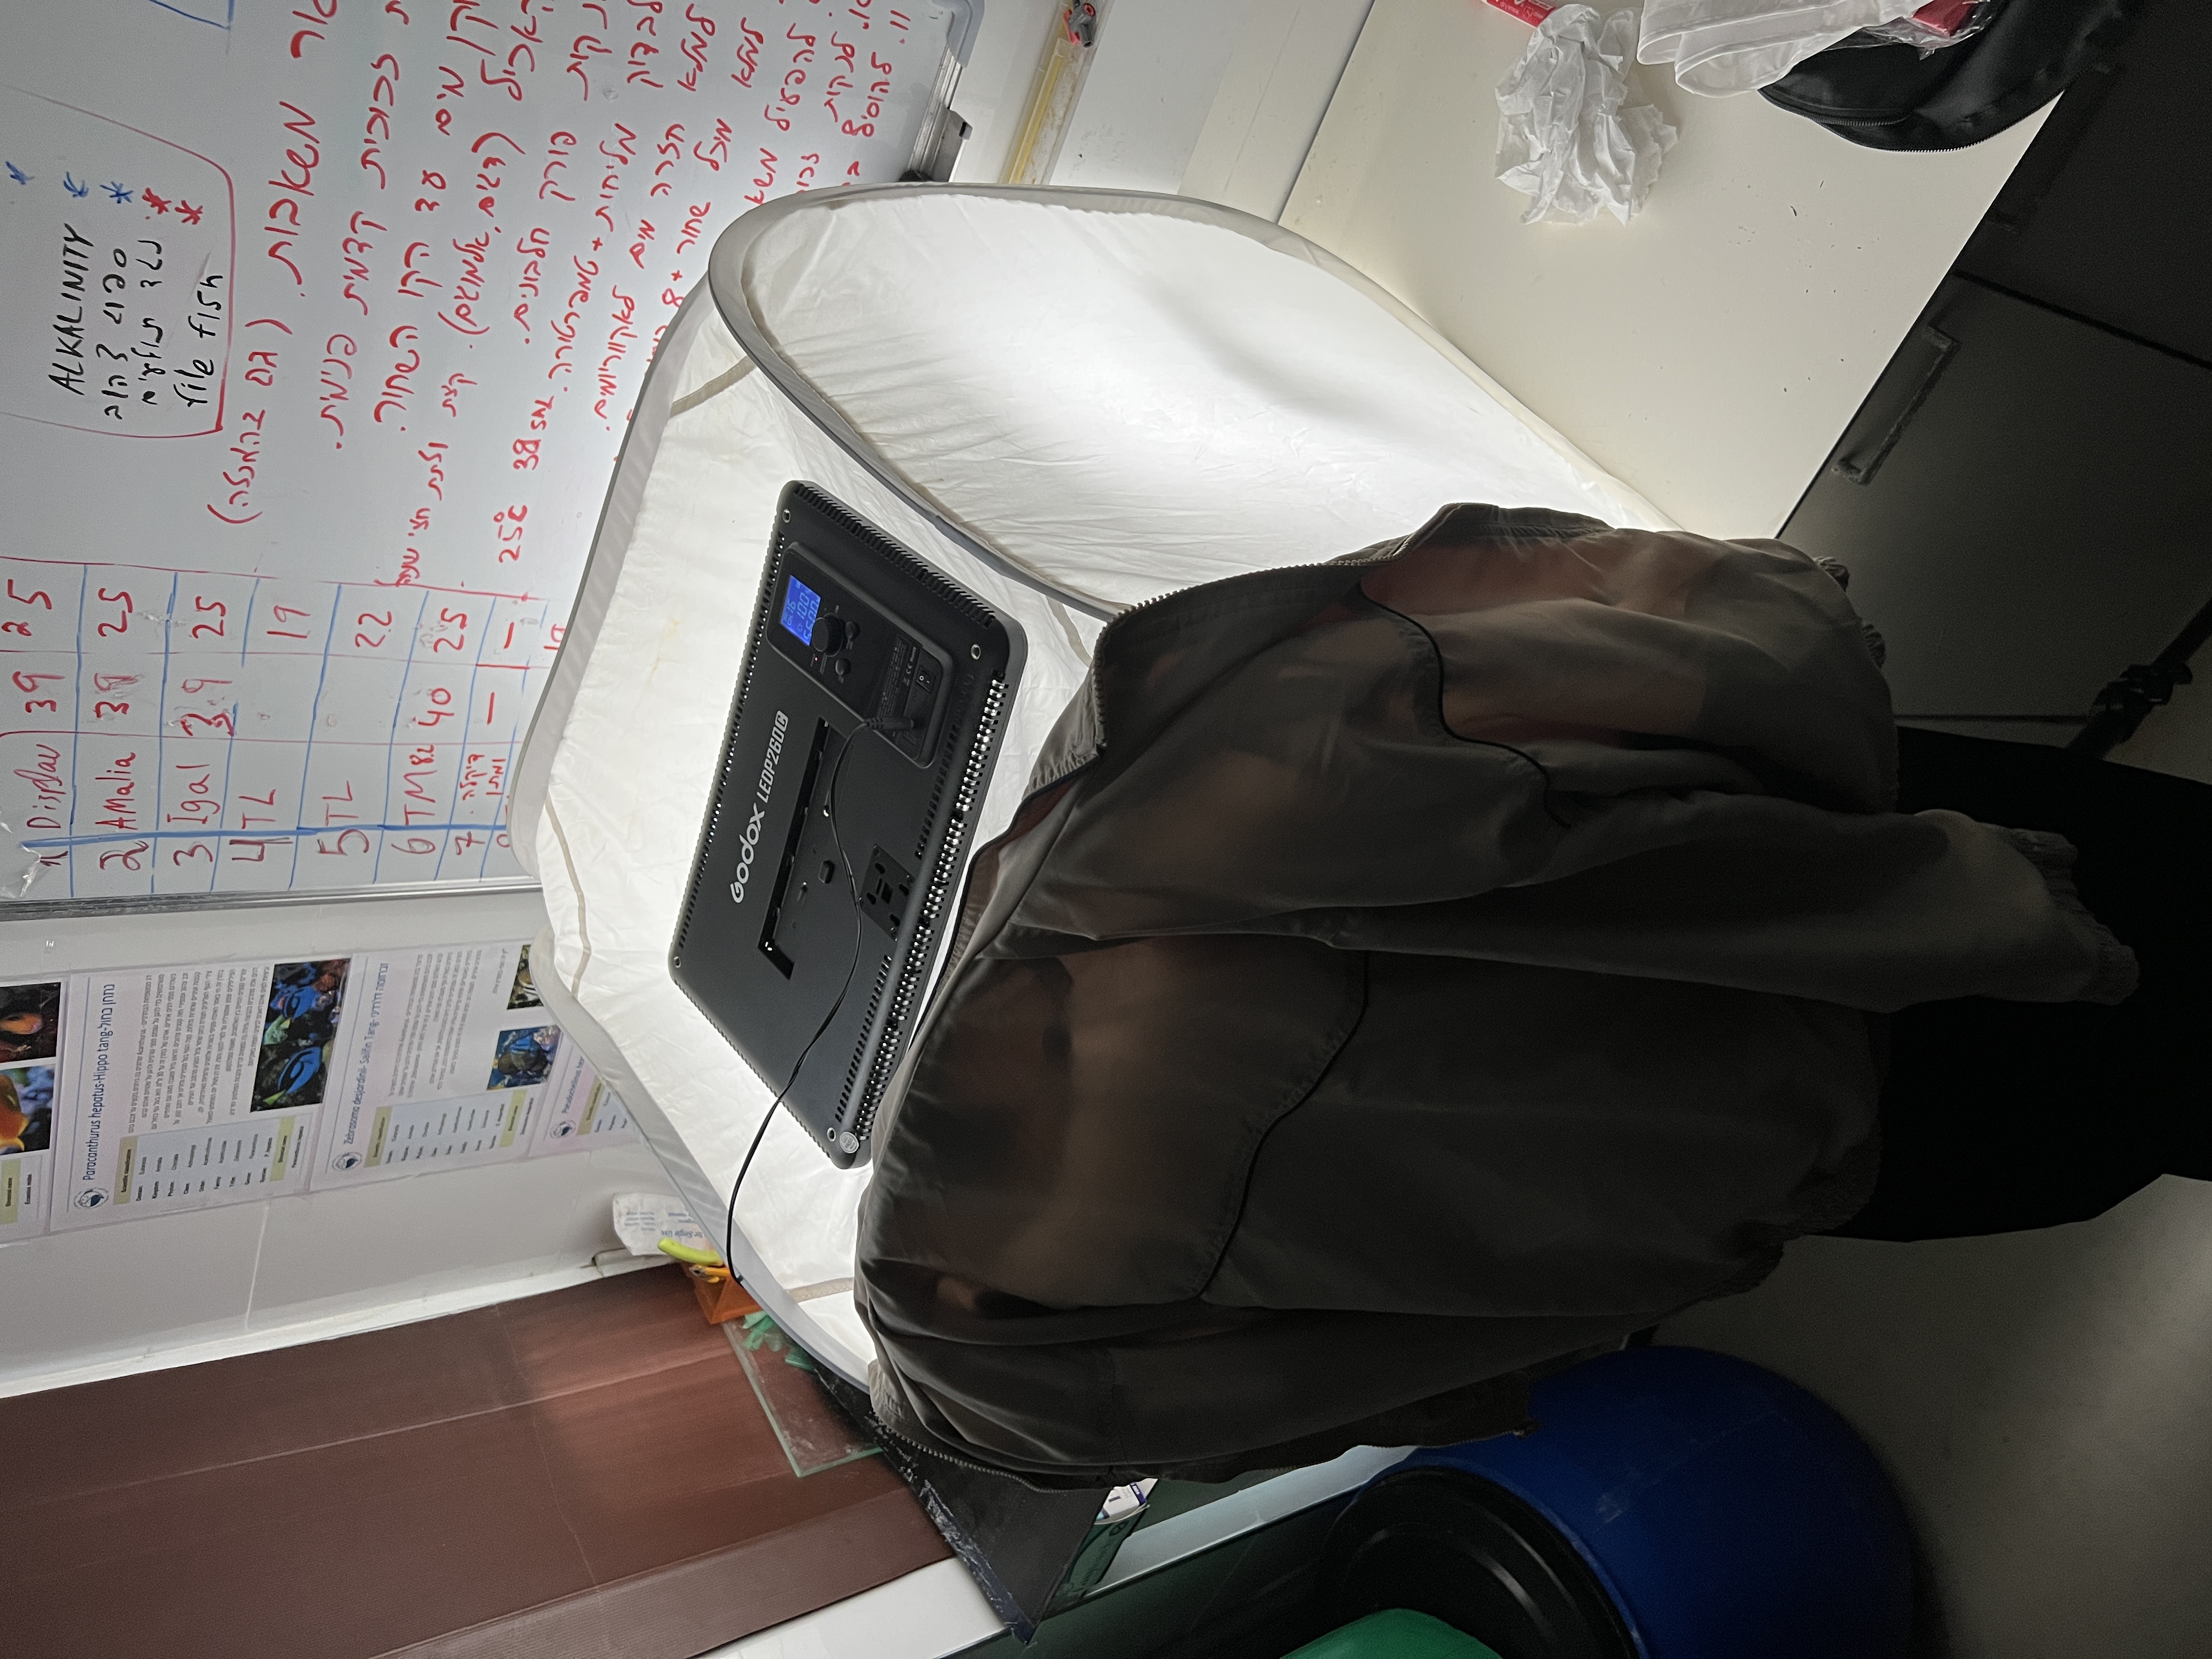 Figure 8: Imaging rig V3 closed with overhead lighting.
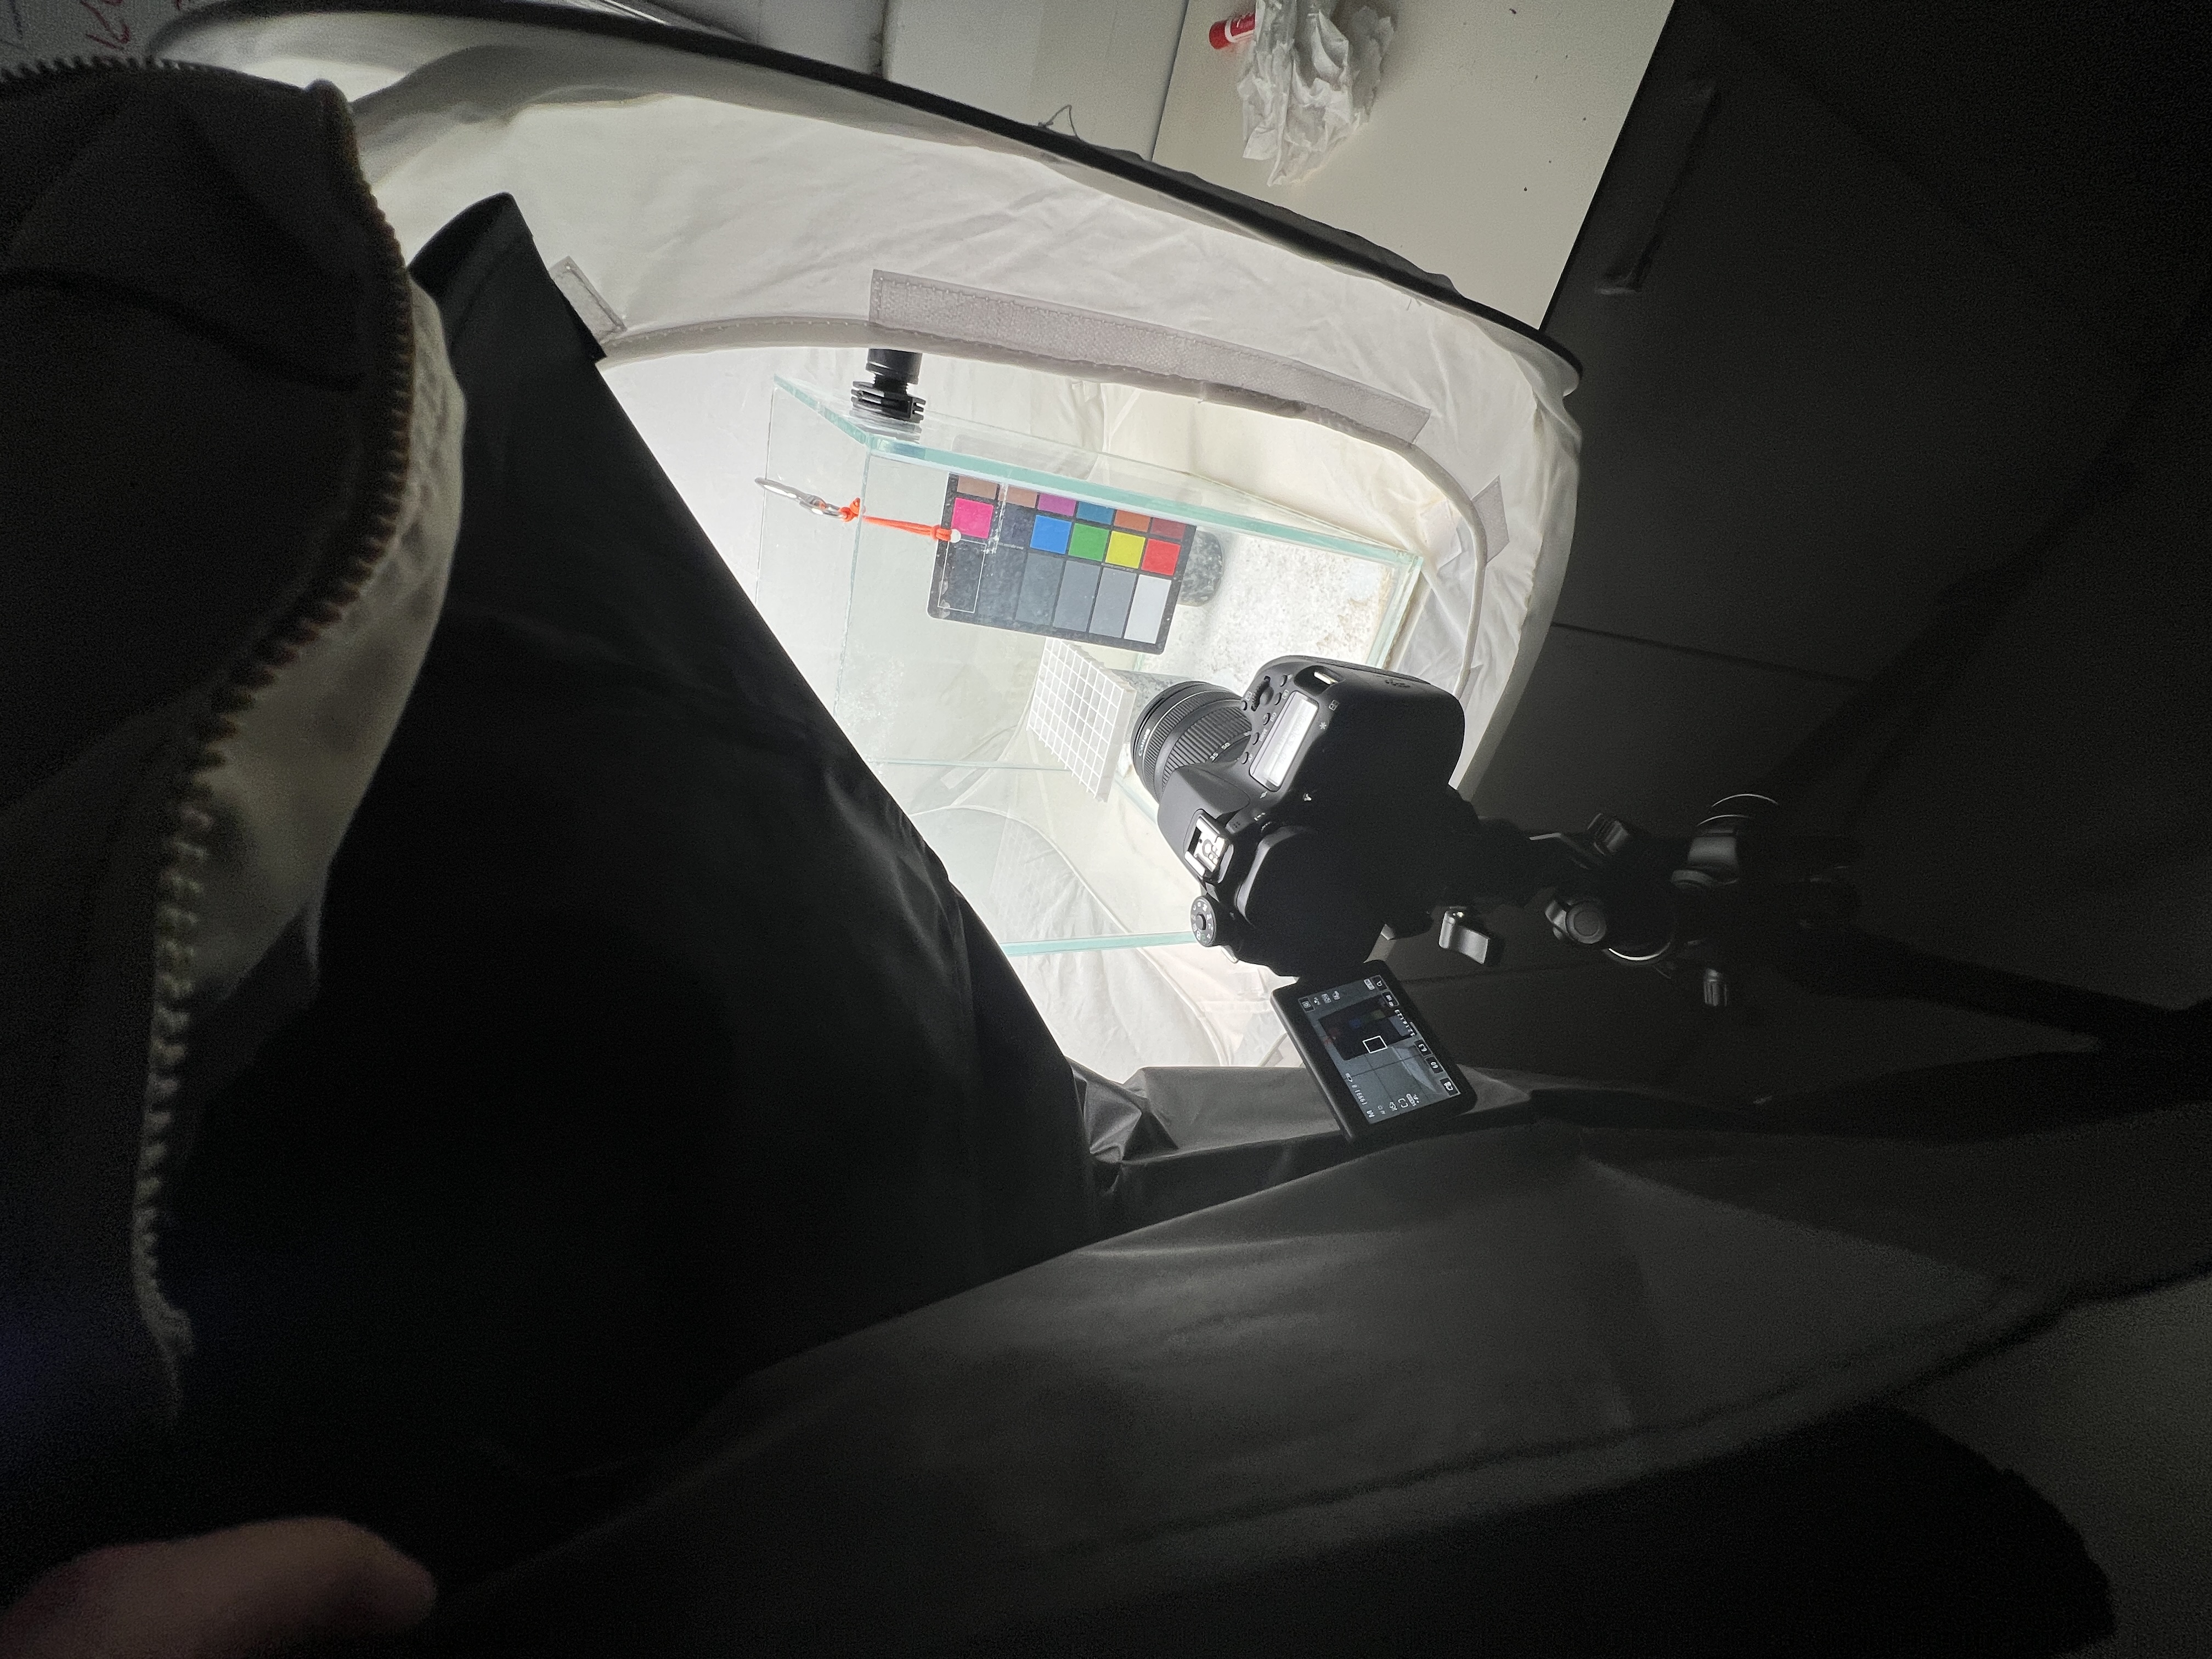 Figure 9: Imaging rig V3 open.
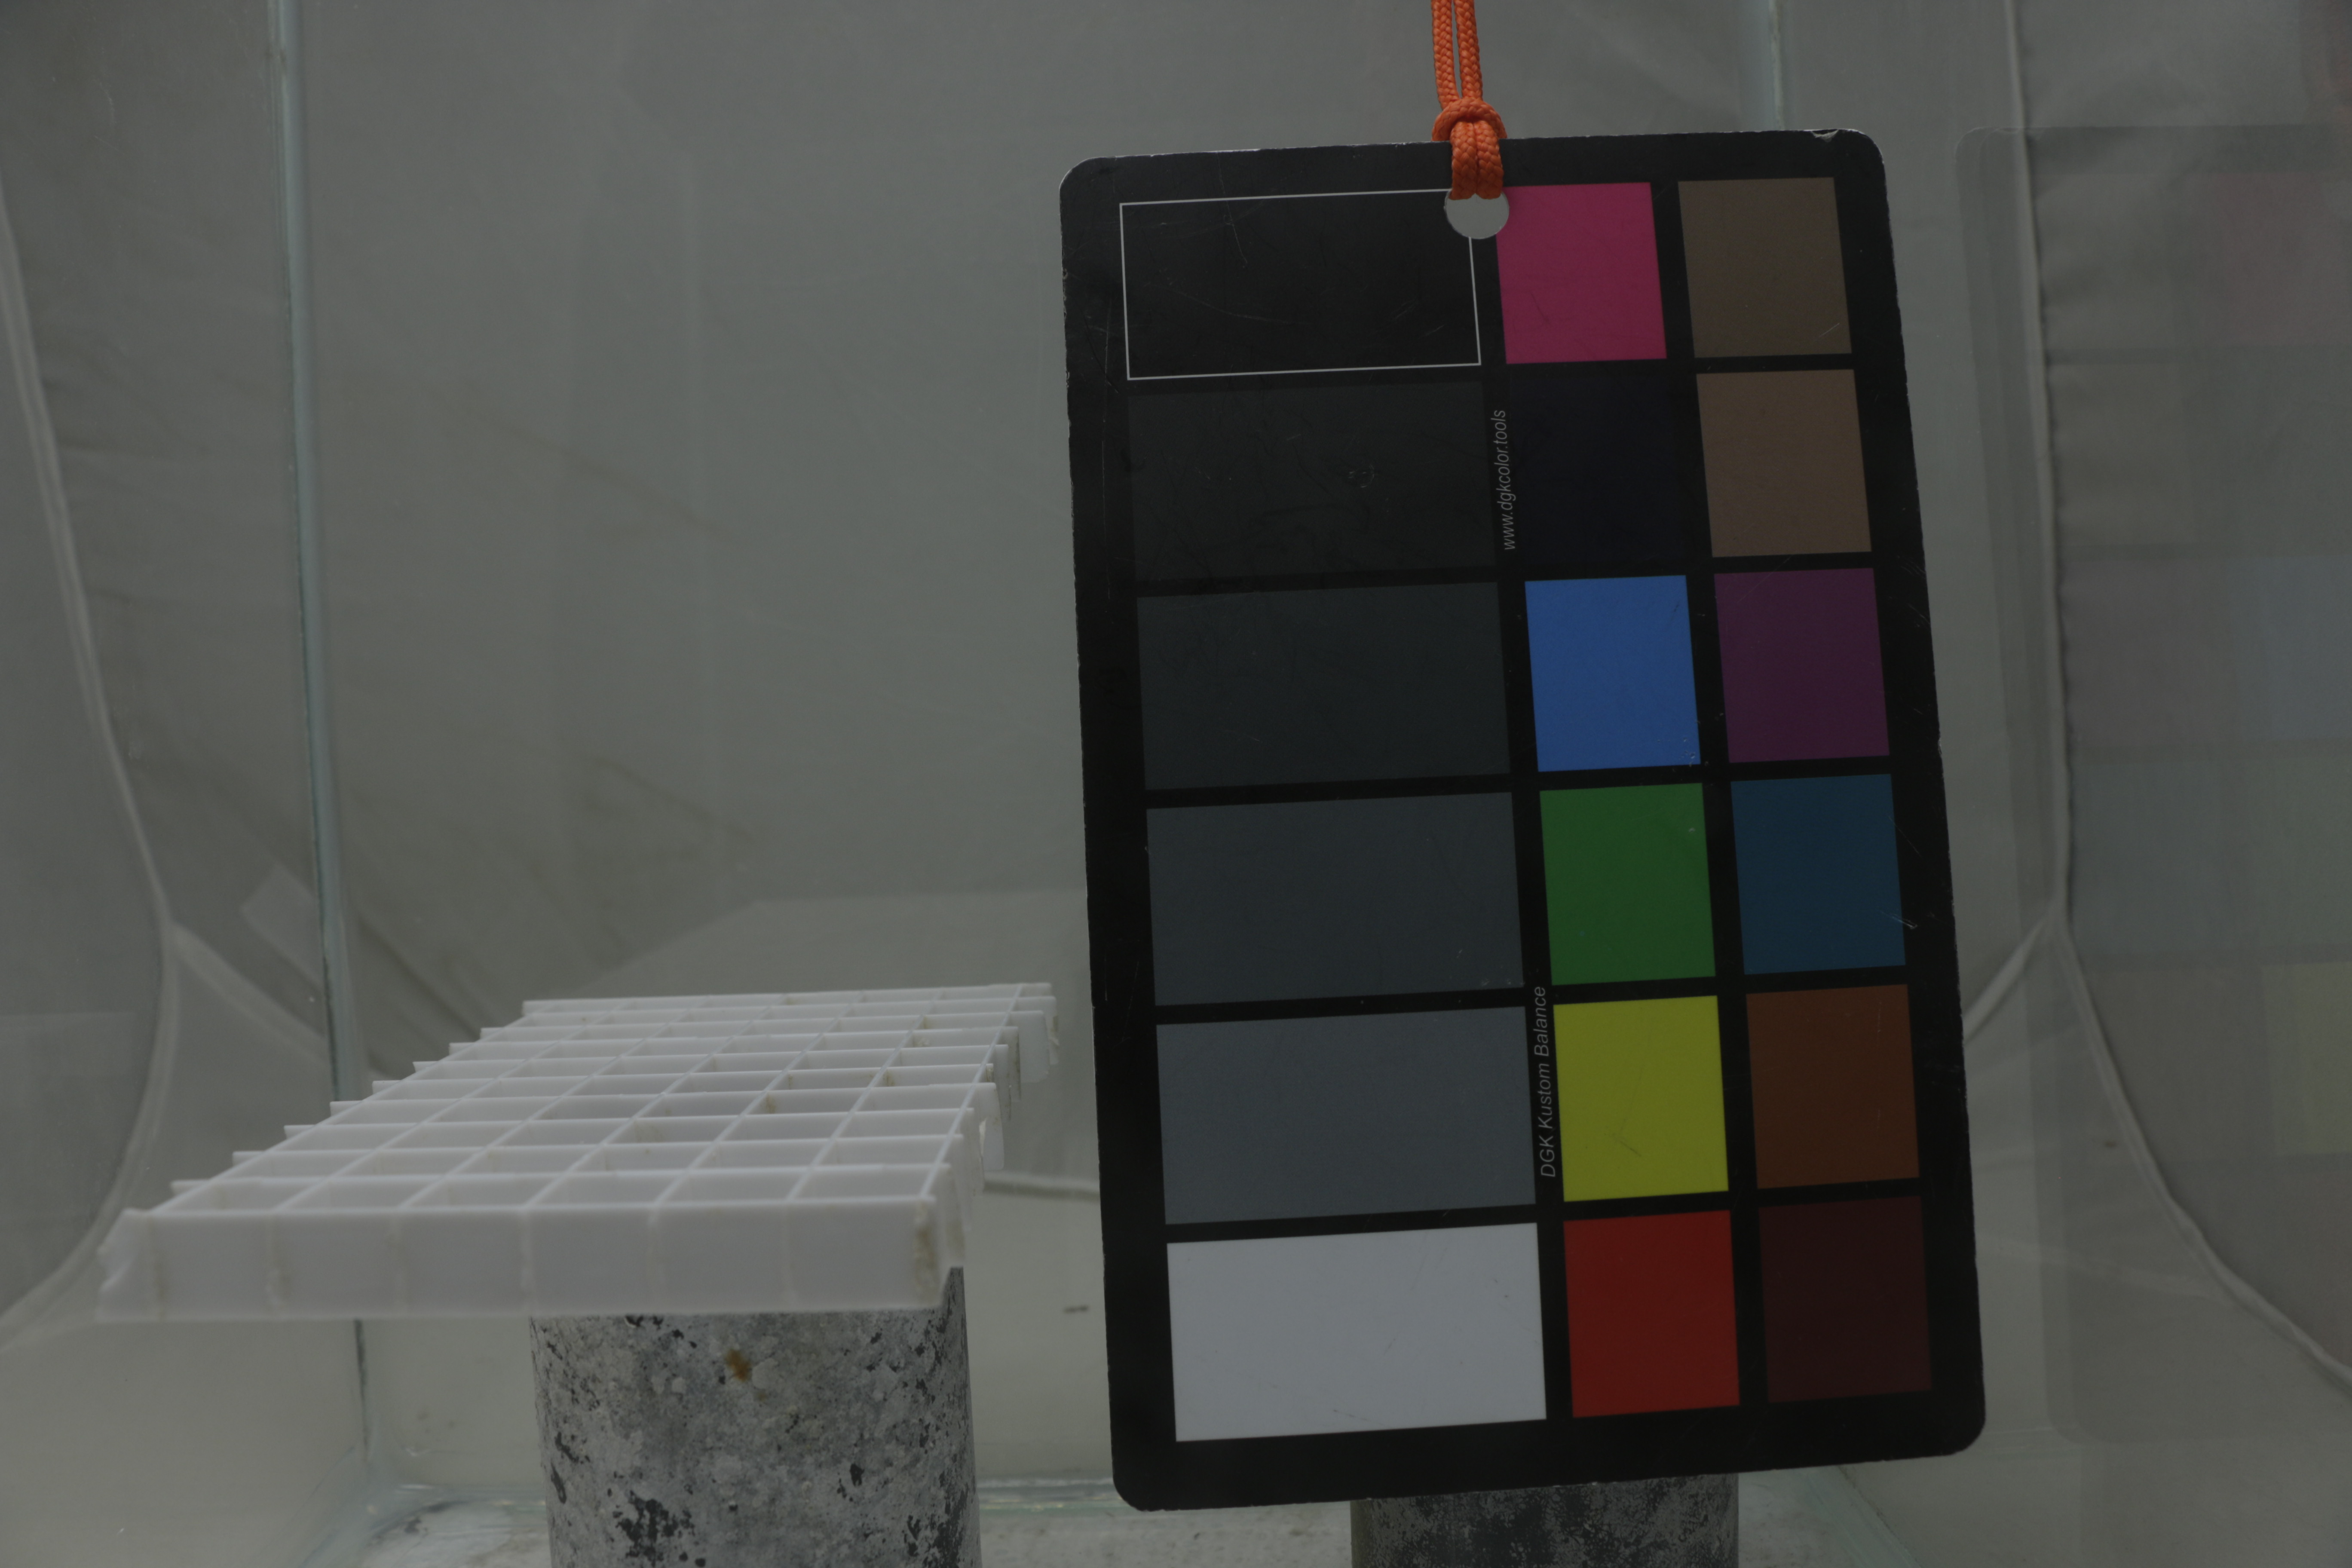 Figure 10: Test image with light box around tank. Reflection on the glass is still an issue.
Imaging rig V4 - Custom-cut black barrier + new label system
To further reduce reflections in the glass, a black barrier was modified to fit the light box and have a small hole big enough for the camera lens to fit through. Additionally, all of the coral nubs were relabelled so that the zip ties would not make them lopsided in the image.
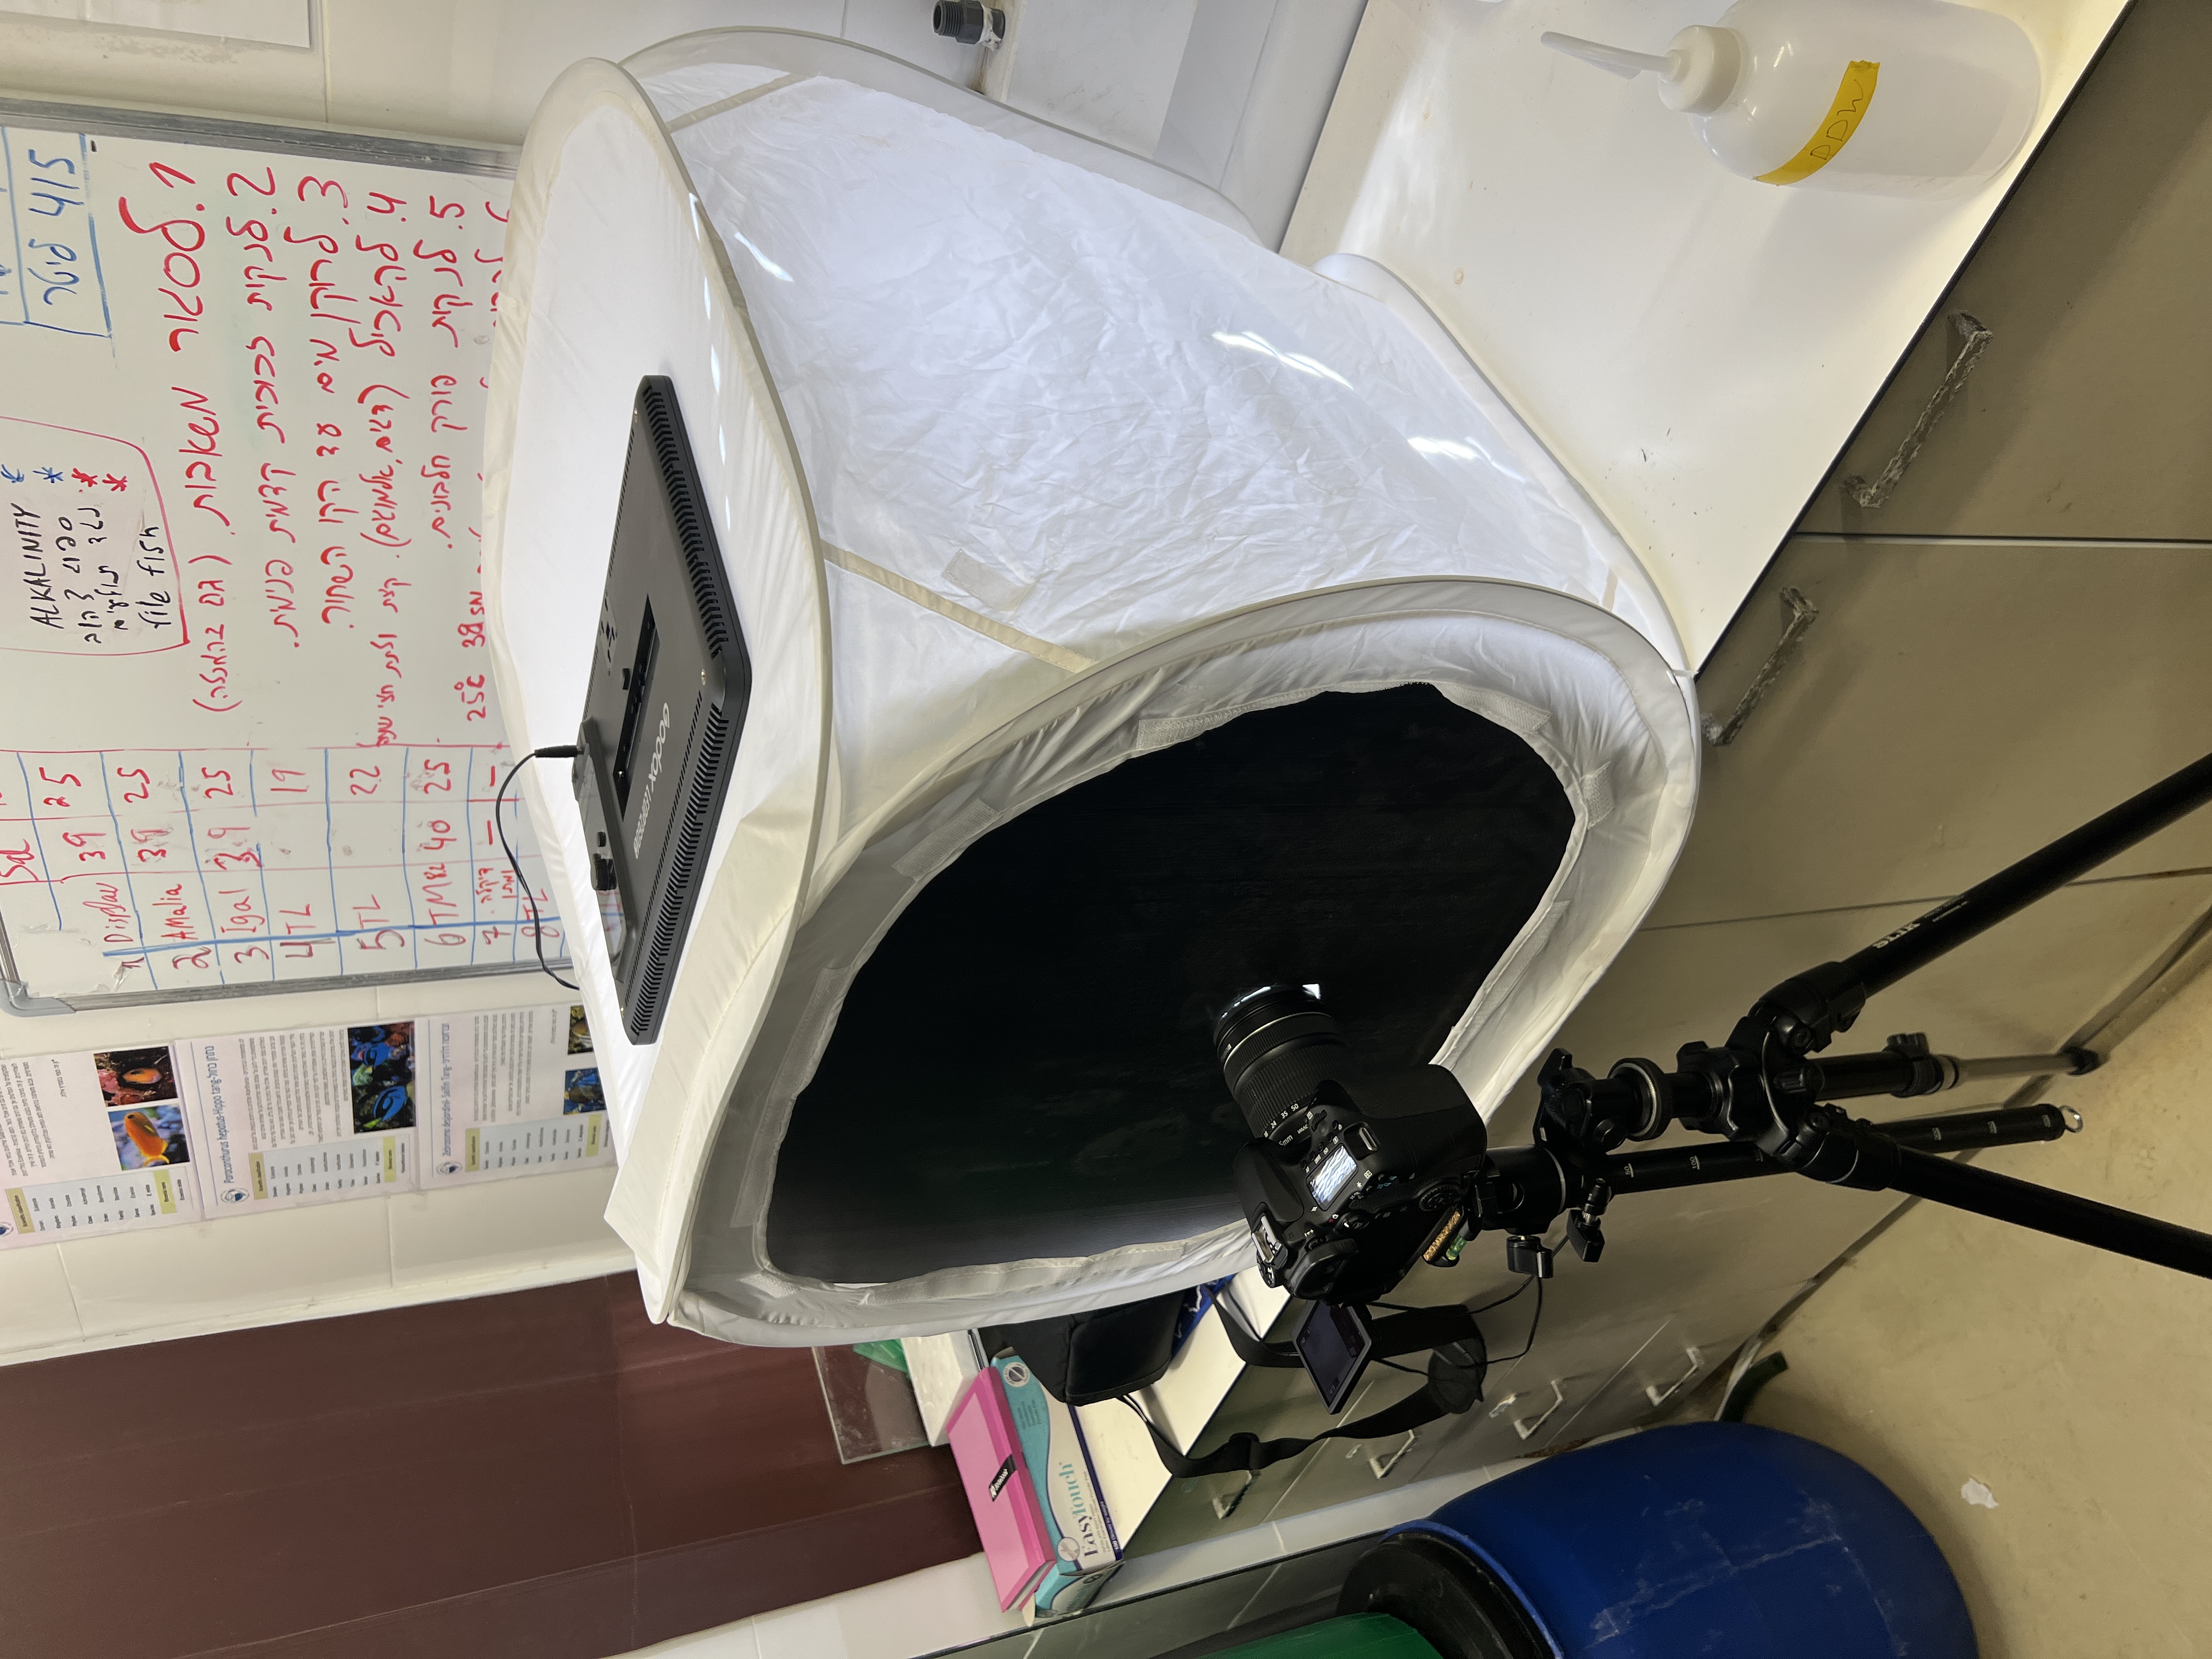 Figure 11: Imaging Rig with the custom black barrier.
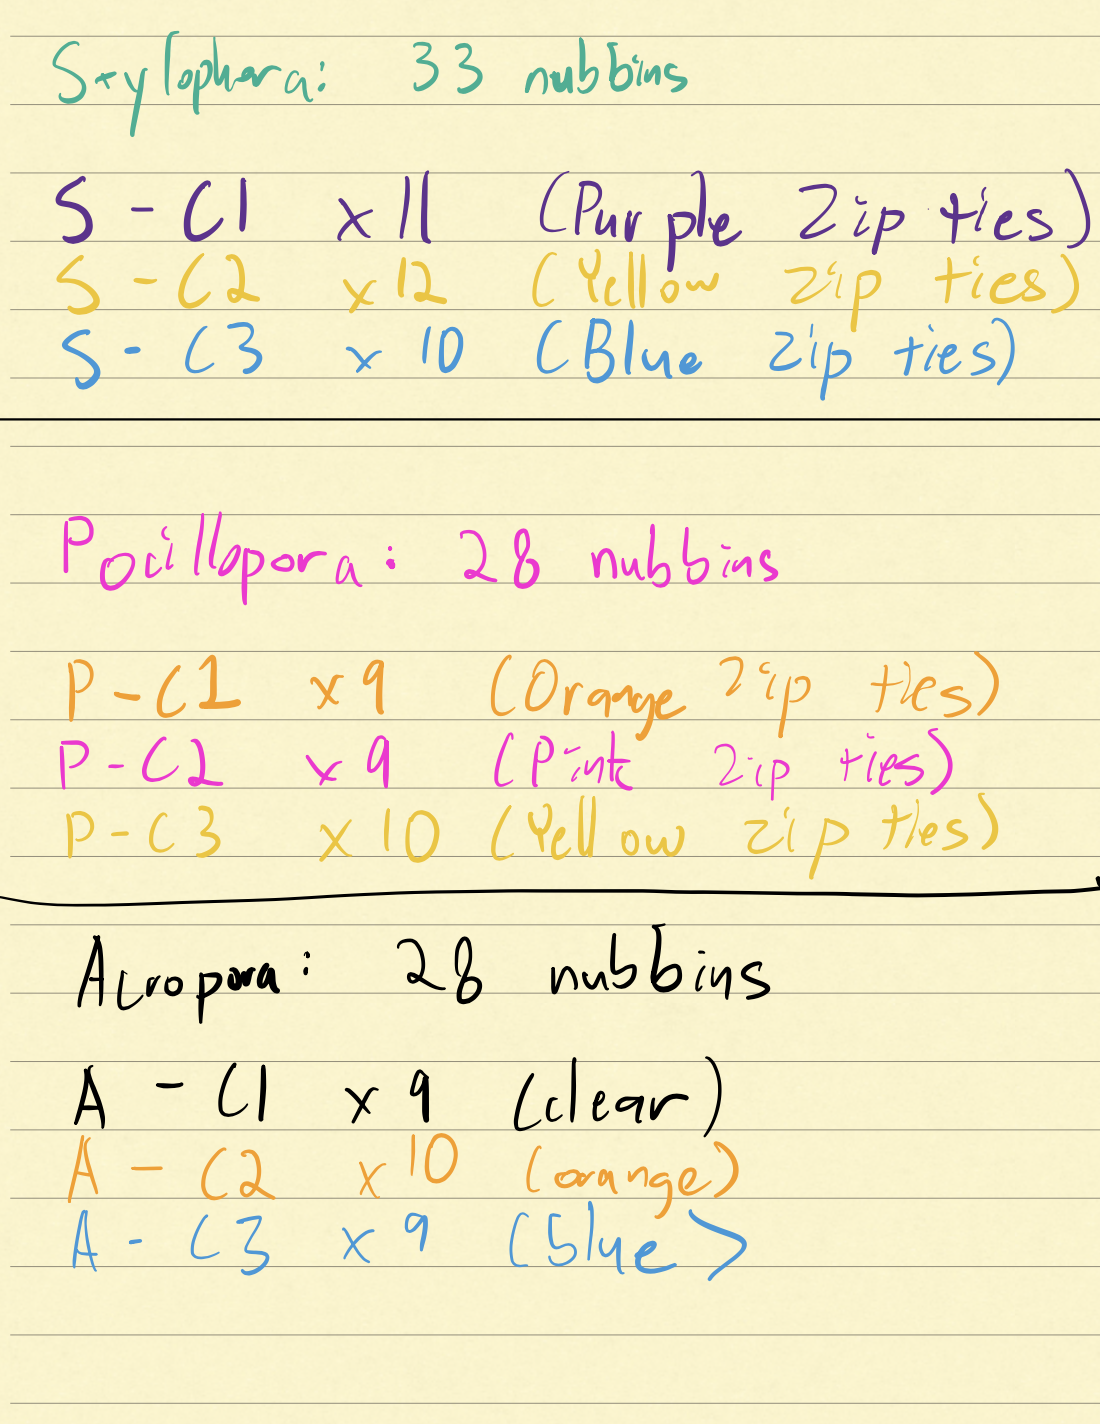 Figure 12: Overview of all the coral colonies and nubs.
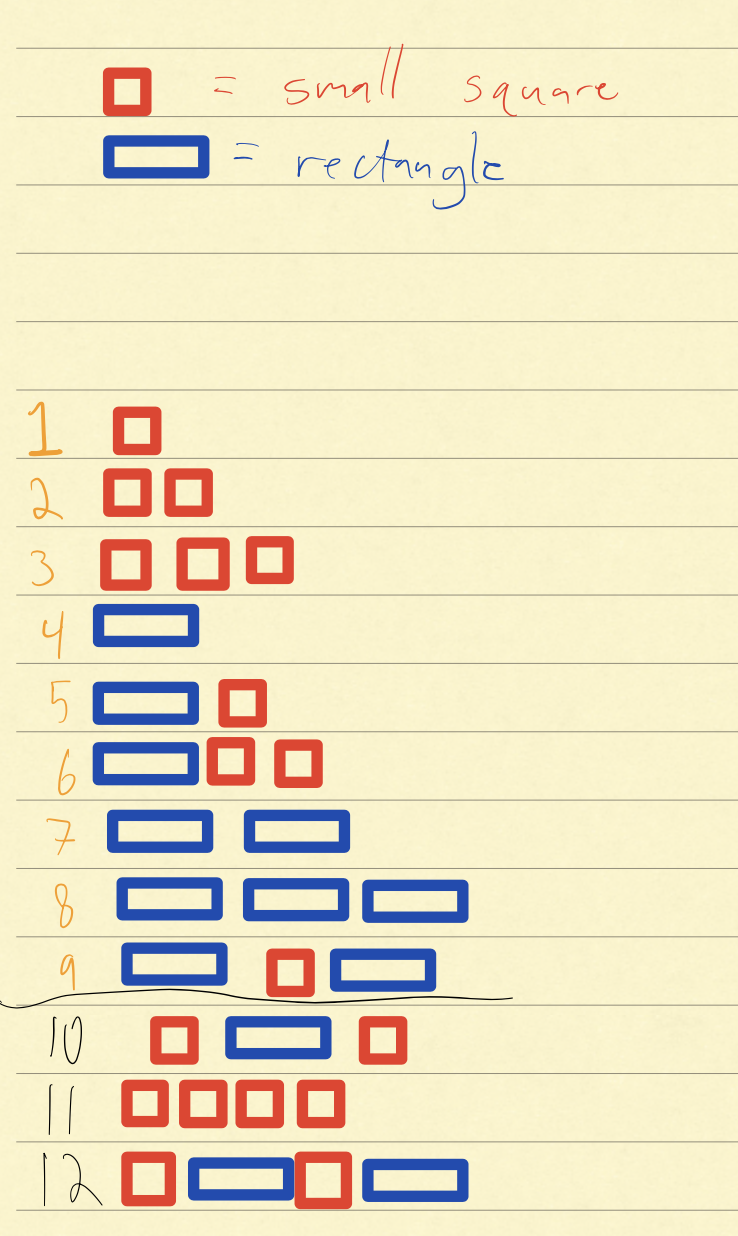 Figure 13: New labelling system.
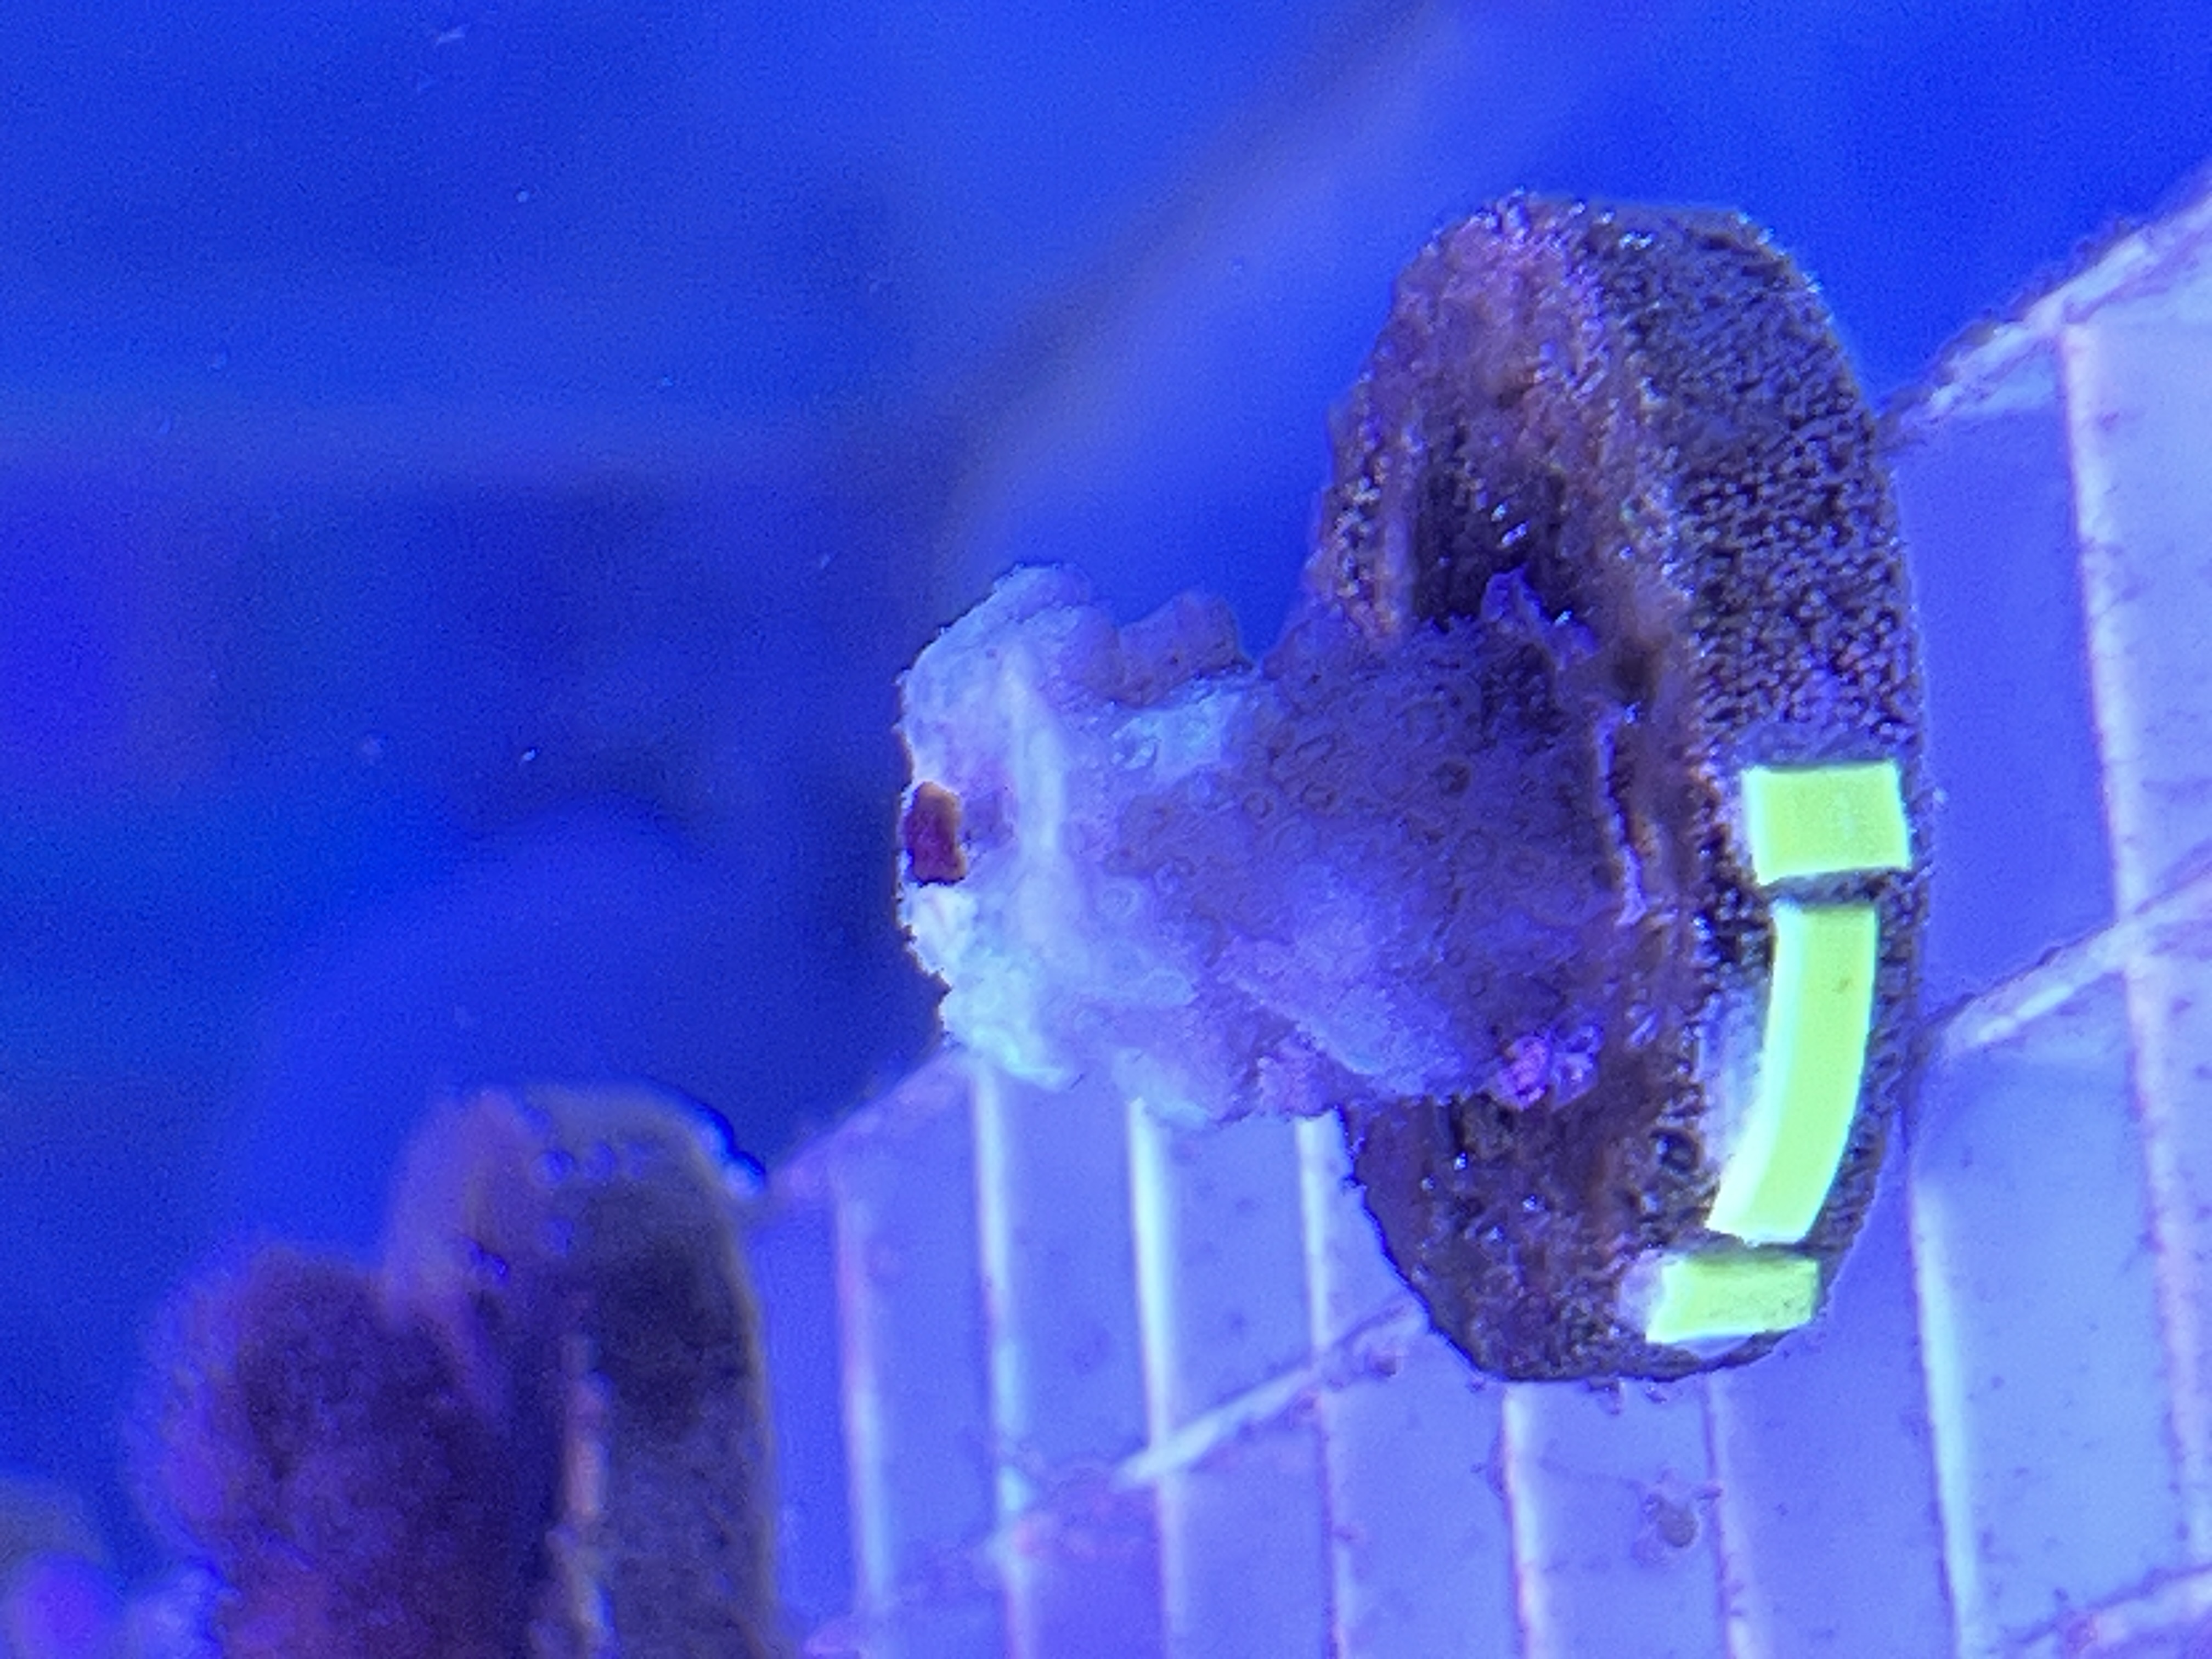 Figure 14: Example image of a coral with the new label system. This coral is Pocillopora, colony 3, nub 10.
Imaging Rig V5 - Overhead Lighting Imaging for All Colonies
In this imaging test, I sampled at least one nub from every colony. Four images were taken for each nub, with a 90 degree rotation between each image to capture all sides of the coral. During this test, one of the LED lights was placed on top of the imaging tent. The color patches of the color chart were analyzed to test consistency across images, and the color of each coral nub was tested for consistency across the four images taken of each nub.
While this version of the imaging rig produced solid results, the overhead lighting presented issues with unwanted shadows present on the underside of corals. Additionally, some corals had natural pigmentation differences due to the healing process from being sliced yielding different tissue properties.
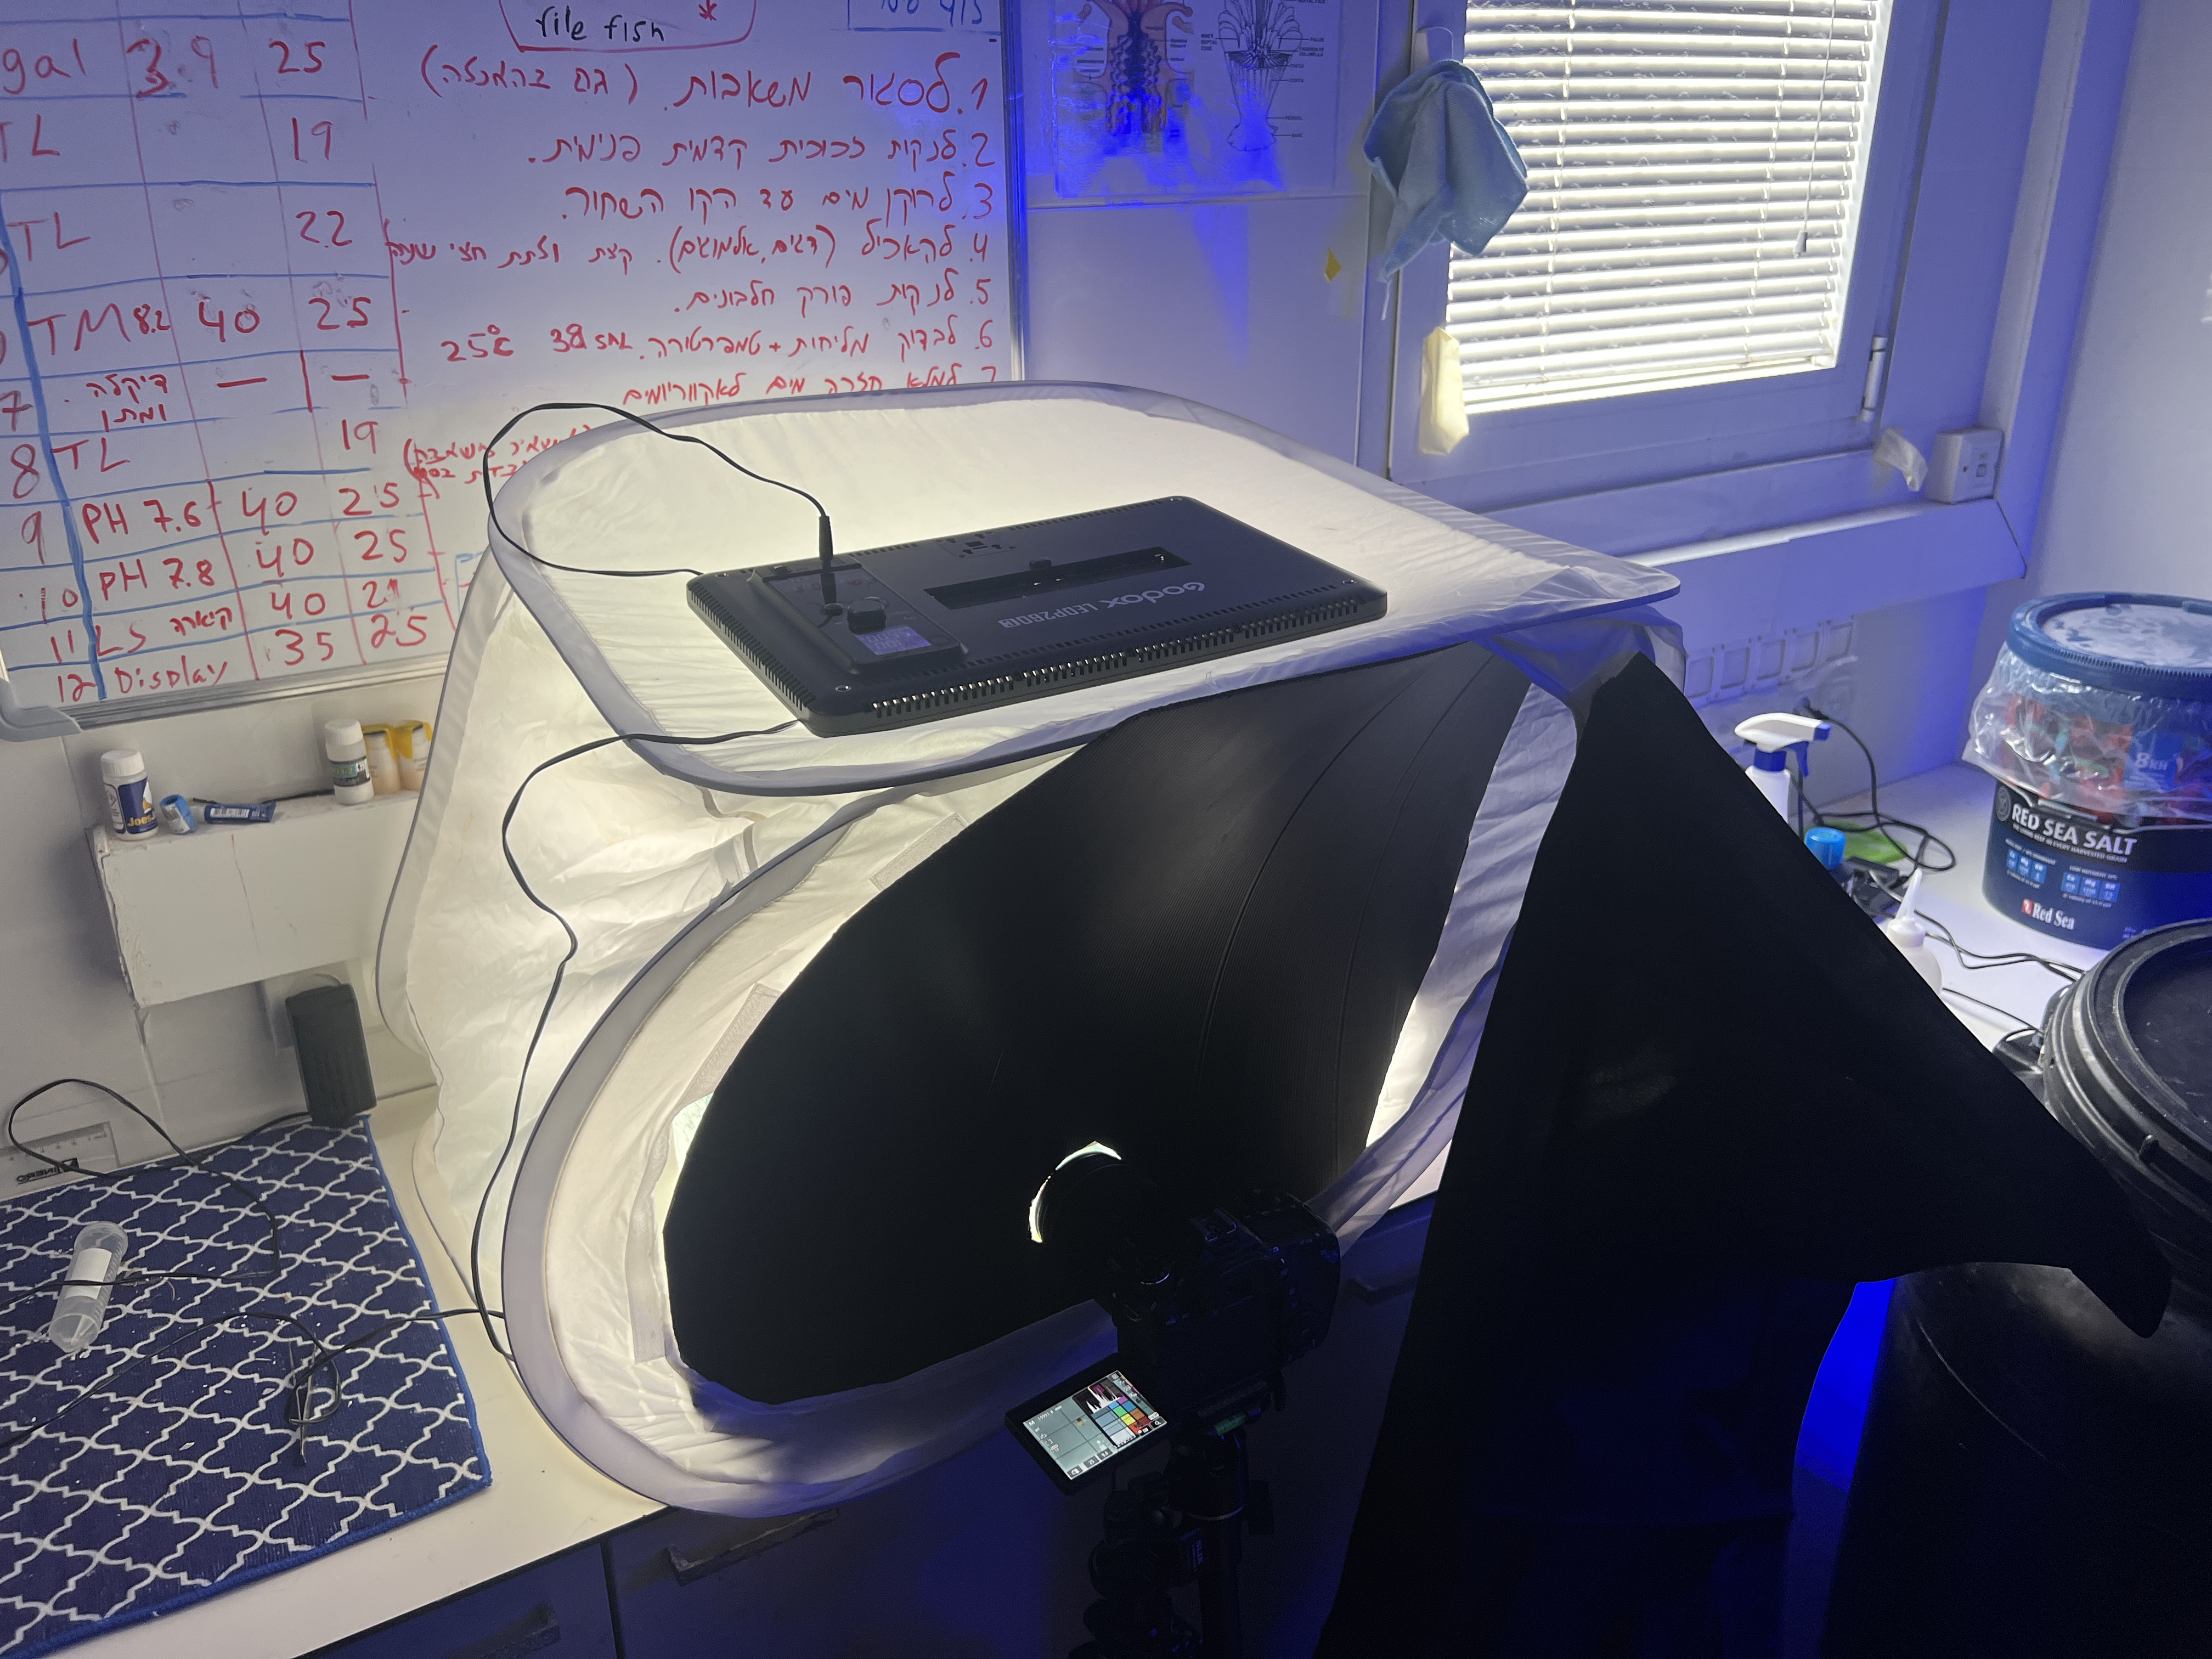 Figure 15: Imaging Rig V5. This version utilizes both the black barrier and a black curtain.
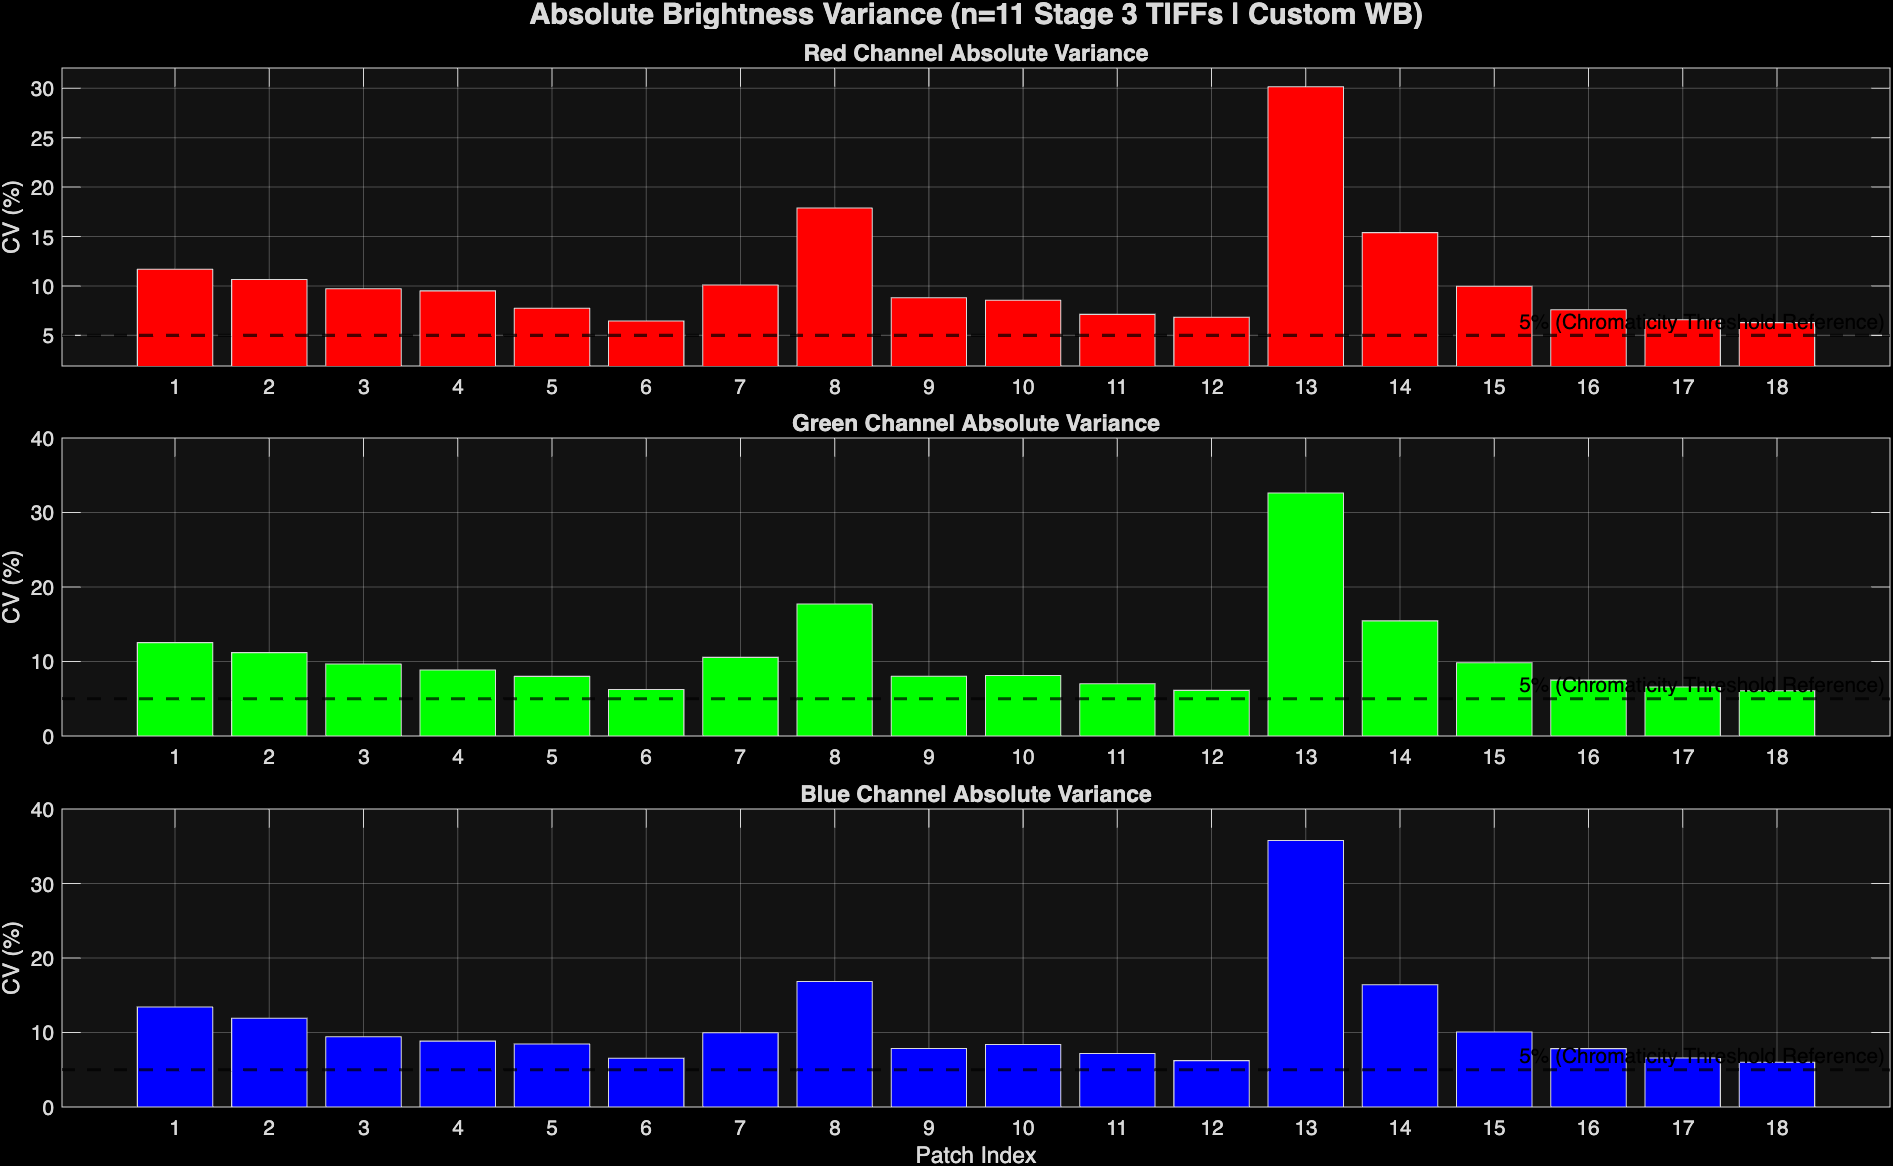 Figure 16: Coefficient of variation (Std dev/ mean) of color patch absolute brightness values on the color chart.
I was initially perplexed by the high variation in patch 13, but I realized this is due to patch 13 being black. Black has very low brightness, so any slight variation leads to a high coefficient of variation due to how the math works out. After this, I started looking at standard deviation rather than coefficient of variation.
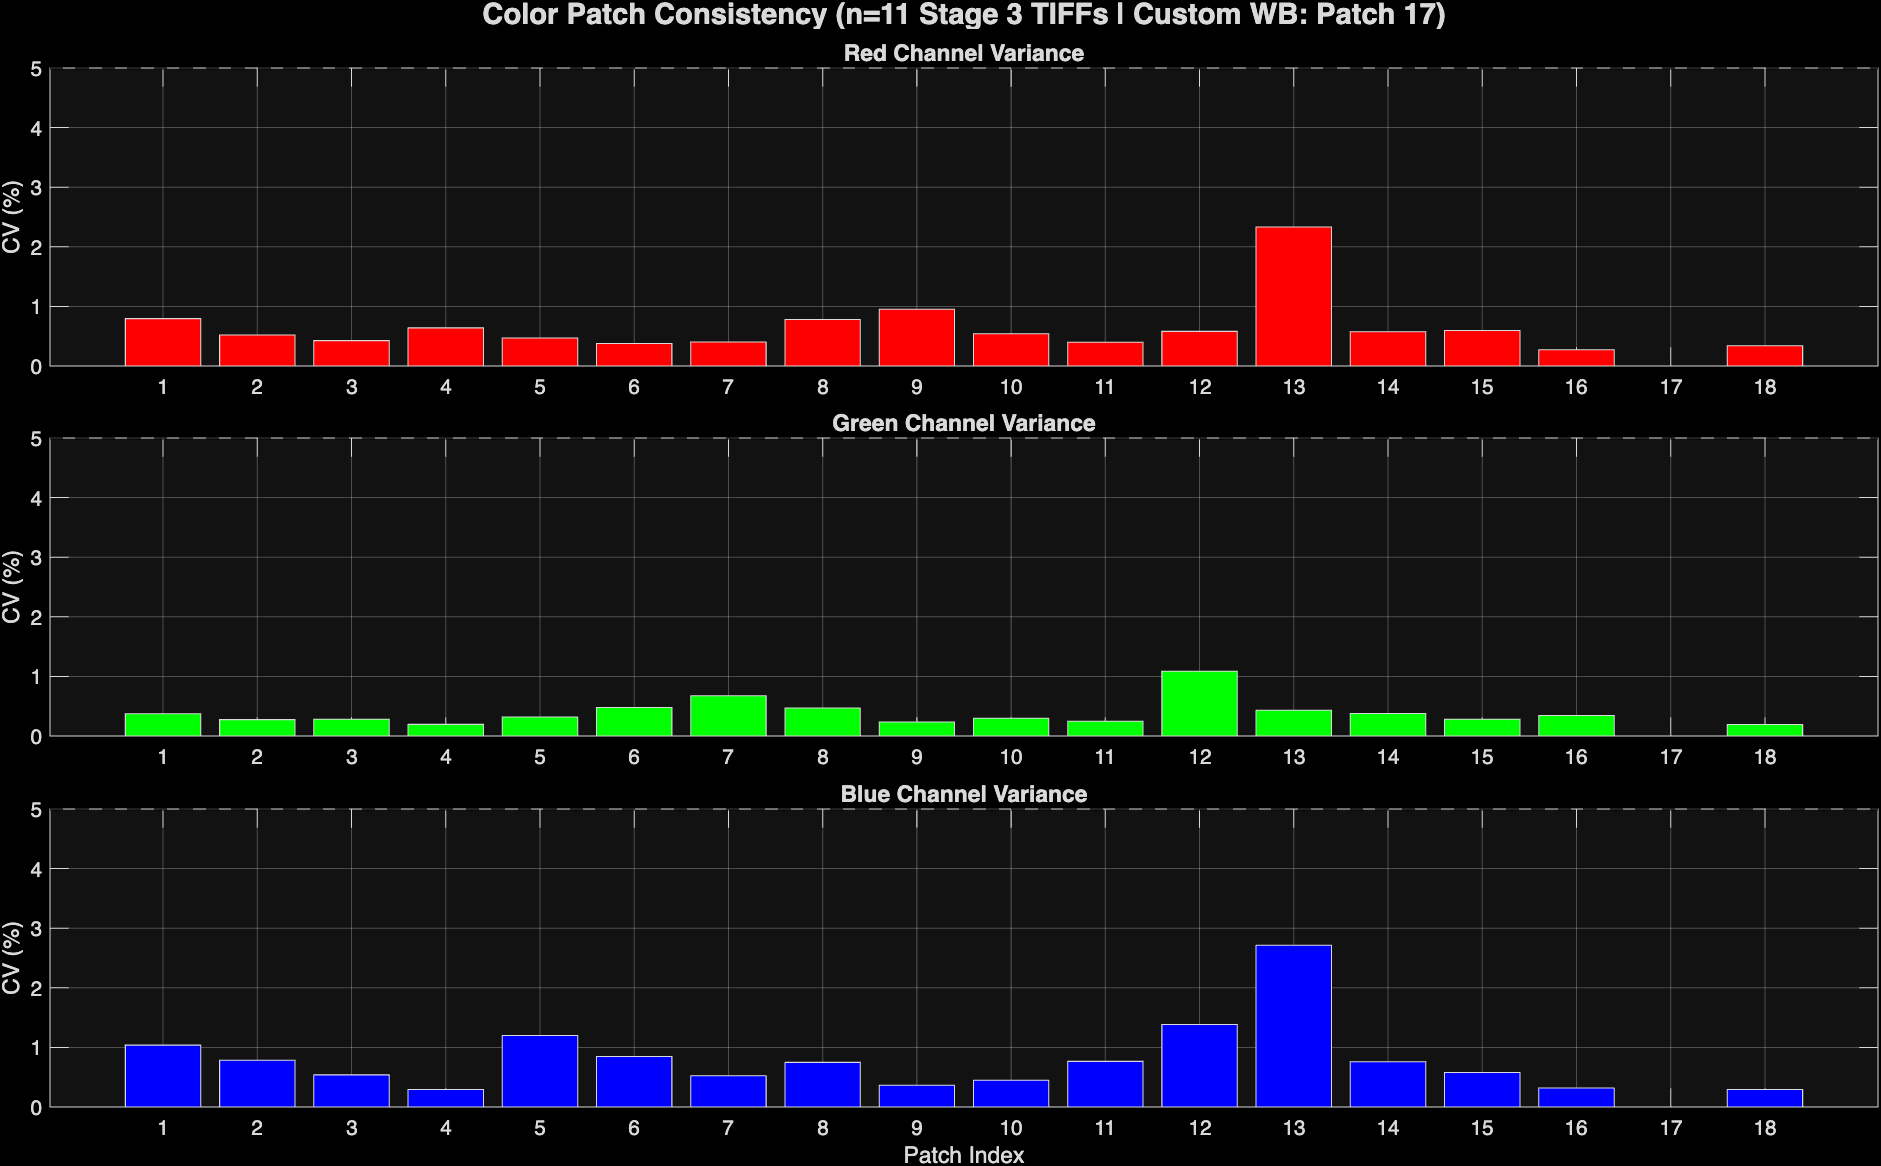 Figure 17: Coefficient of Variation for chromaticity values rather than absolute brightness.
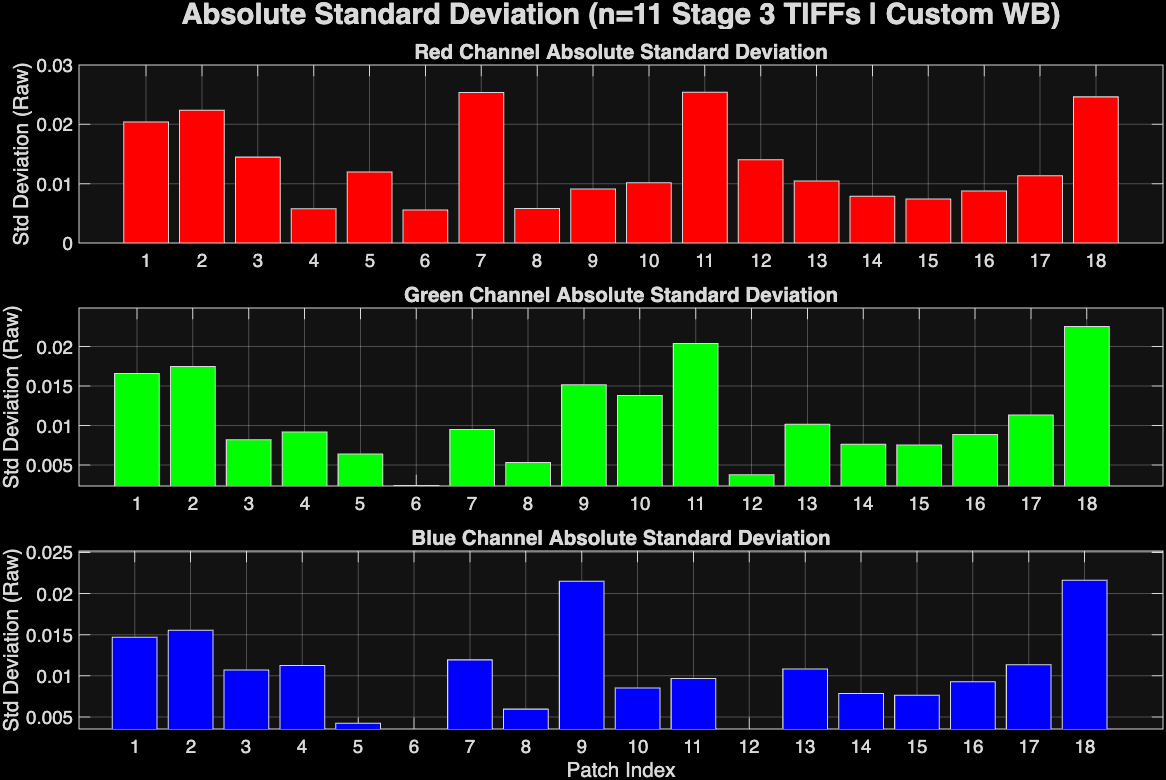 Figure 18: Standard deviation of the color chart patches across 11 images from imaging rig v5.
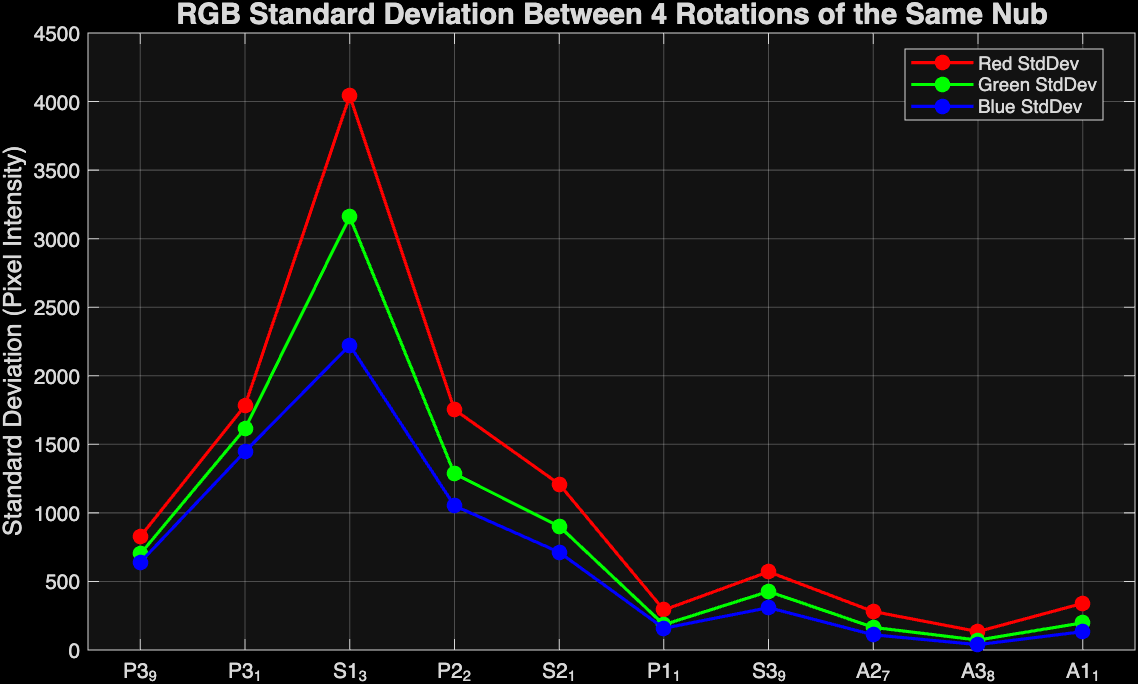 Figure 19: Intra-nub standard deviation of color values. The high deviations in S1-3 are due to actual color differences rather than lighting differences (see later images of S1-3, F20-F23).
Note that 16-bit images have 65,536 steps of intensity.
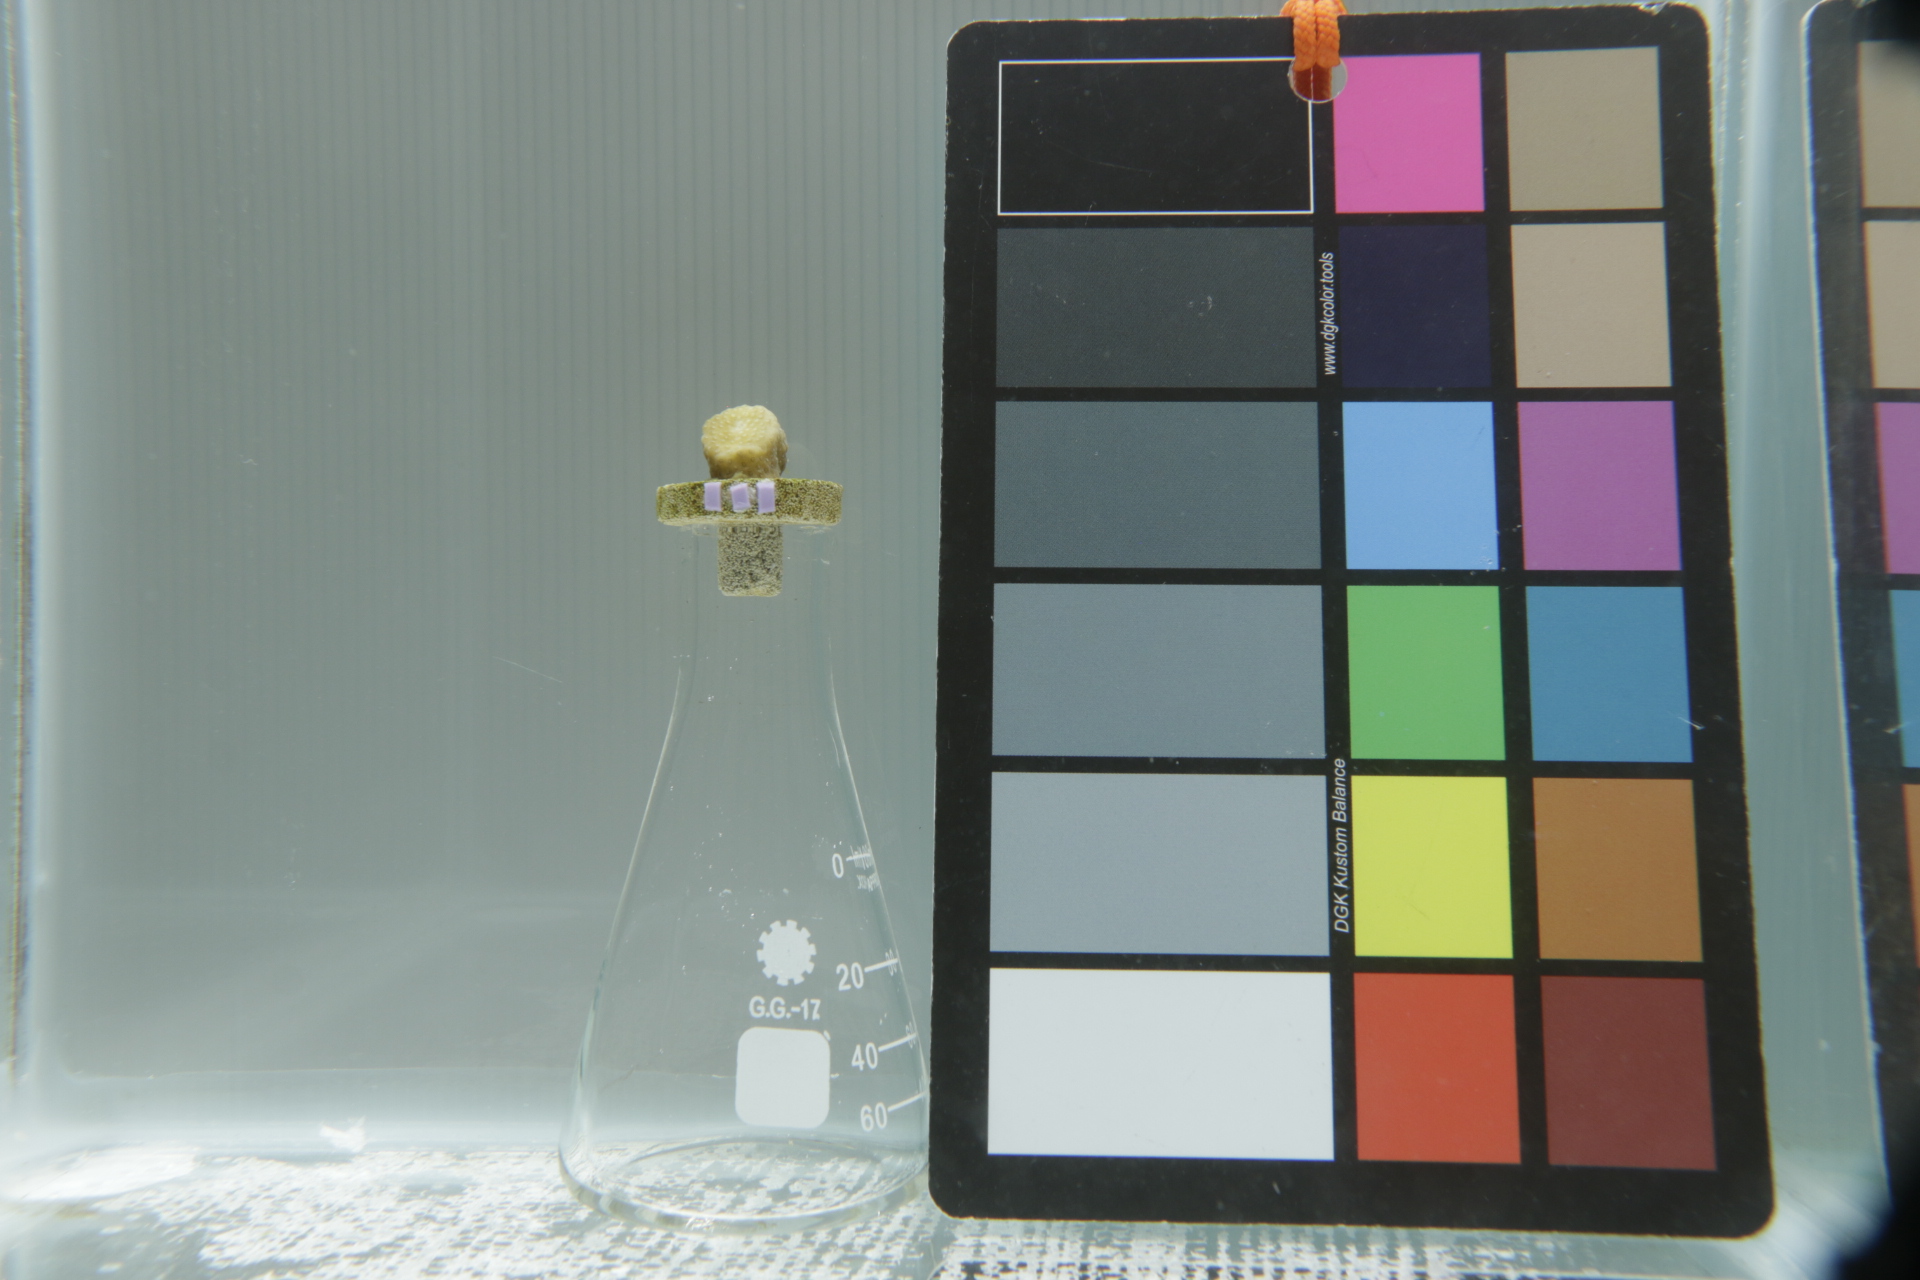 Figure 20: Nub S1-3 image 1. Notice the brighter section on top due to previous slicing.
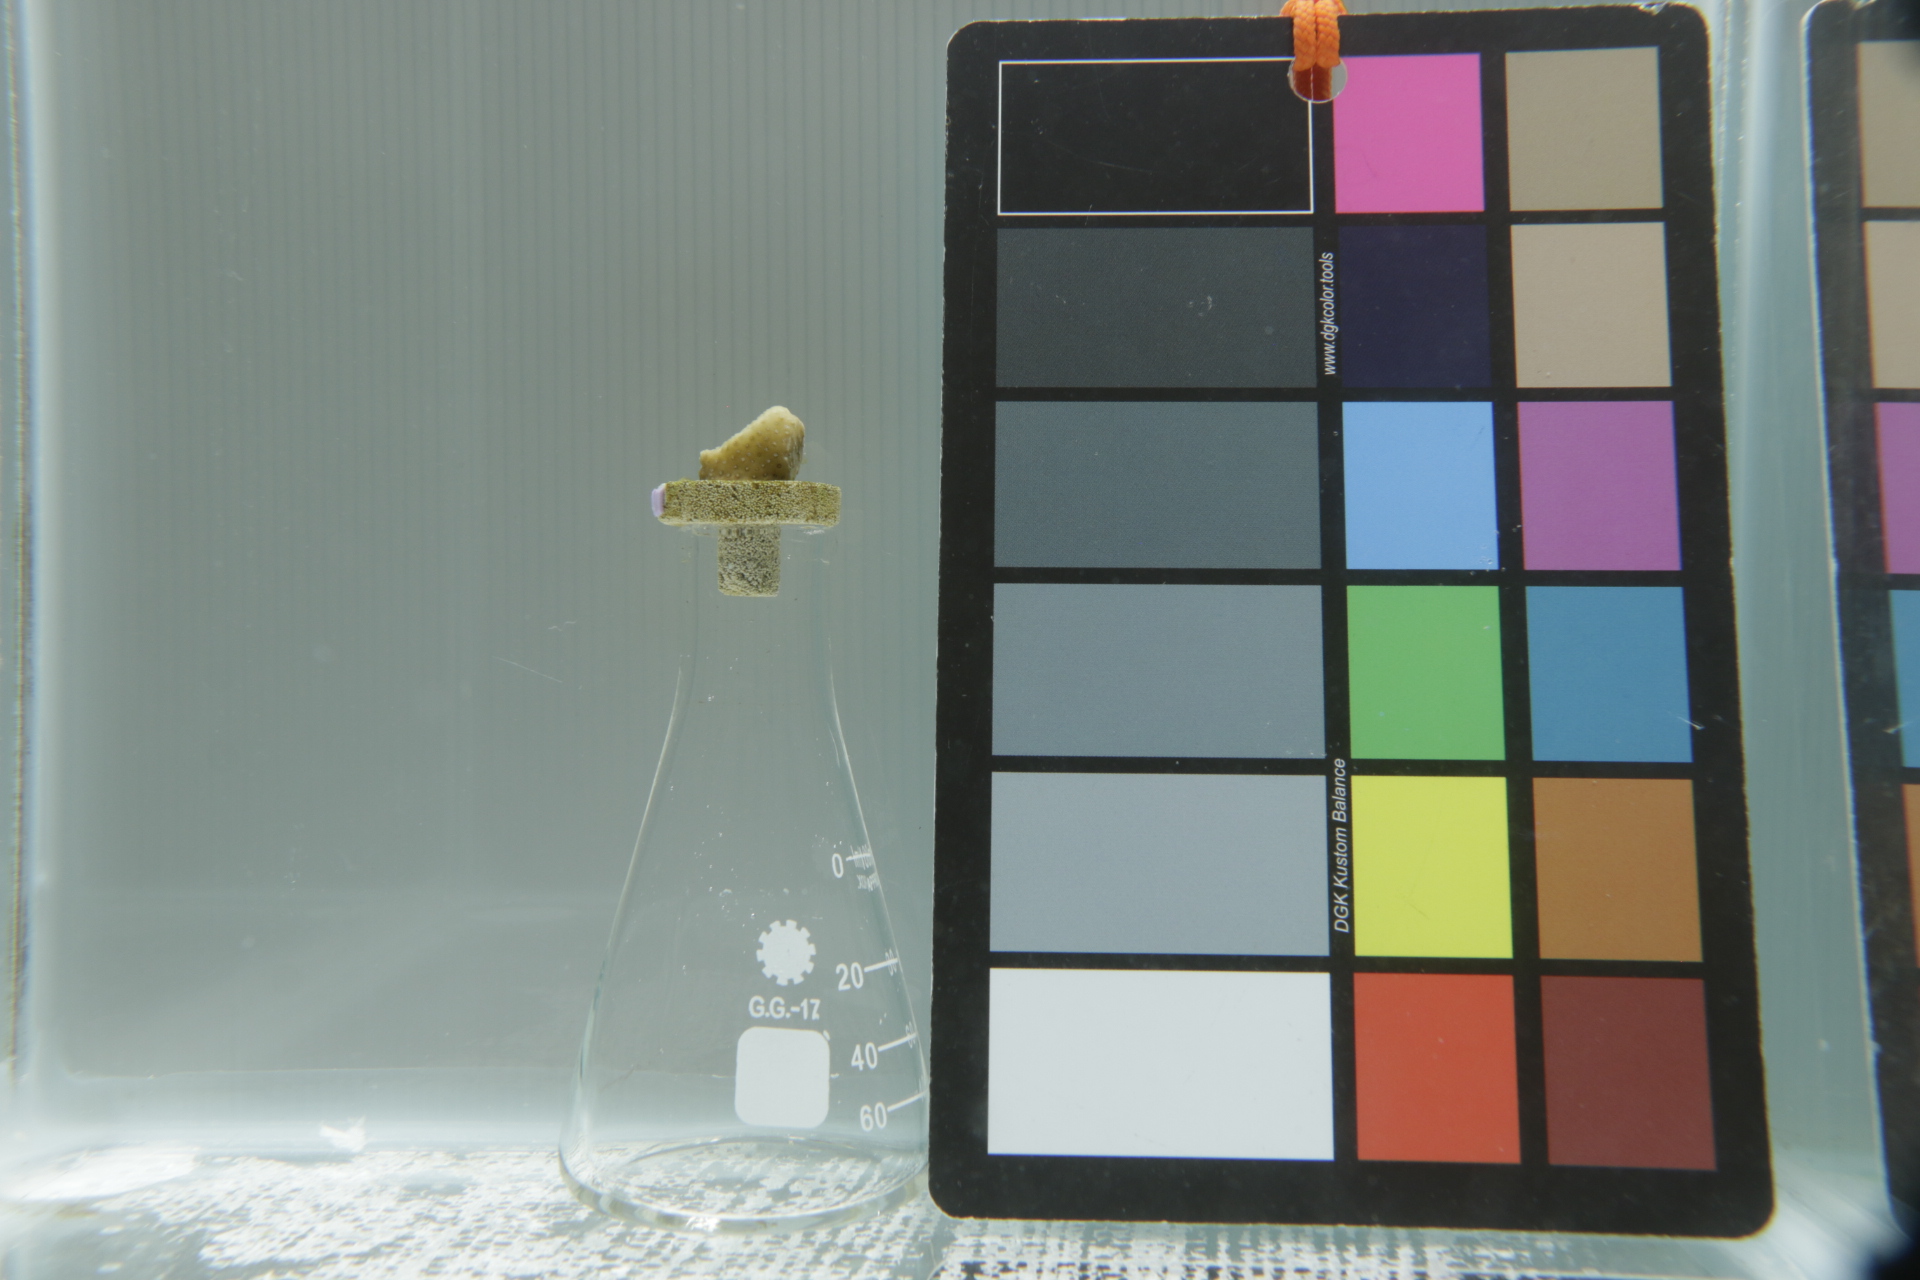 Figure 21: Nub S1-3 image two.
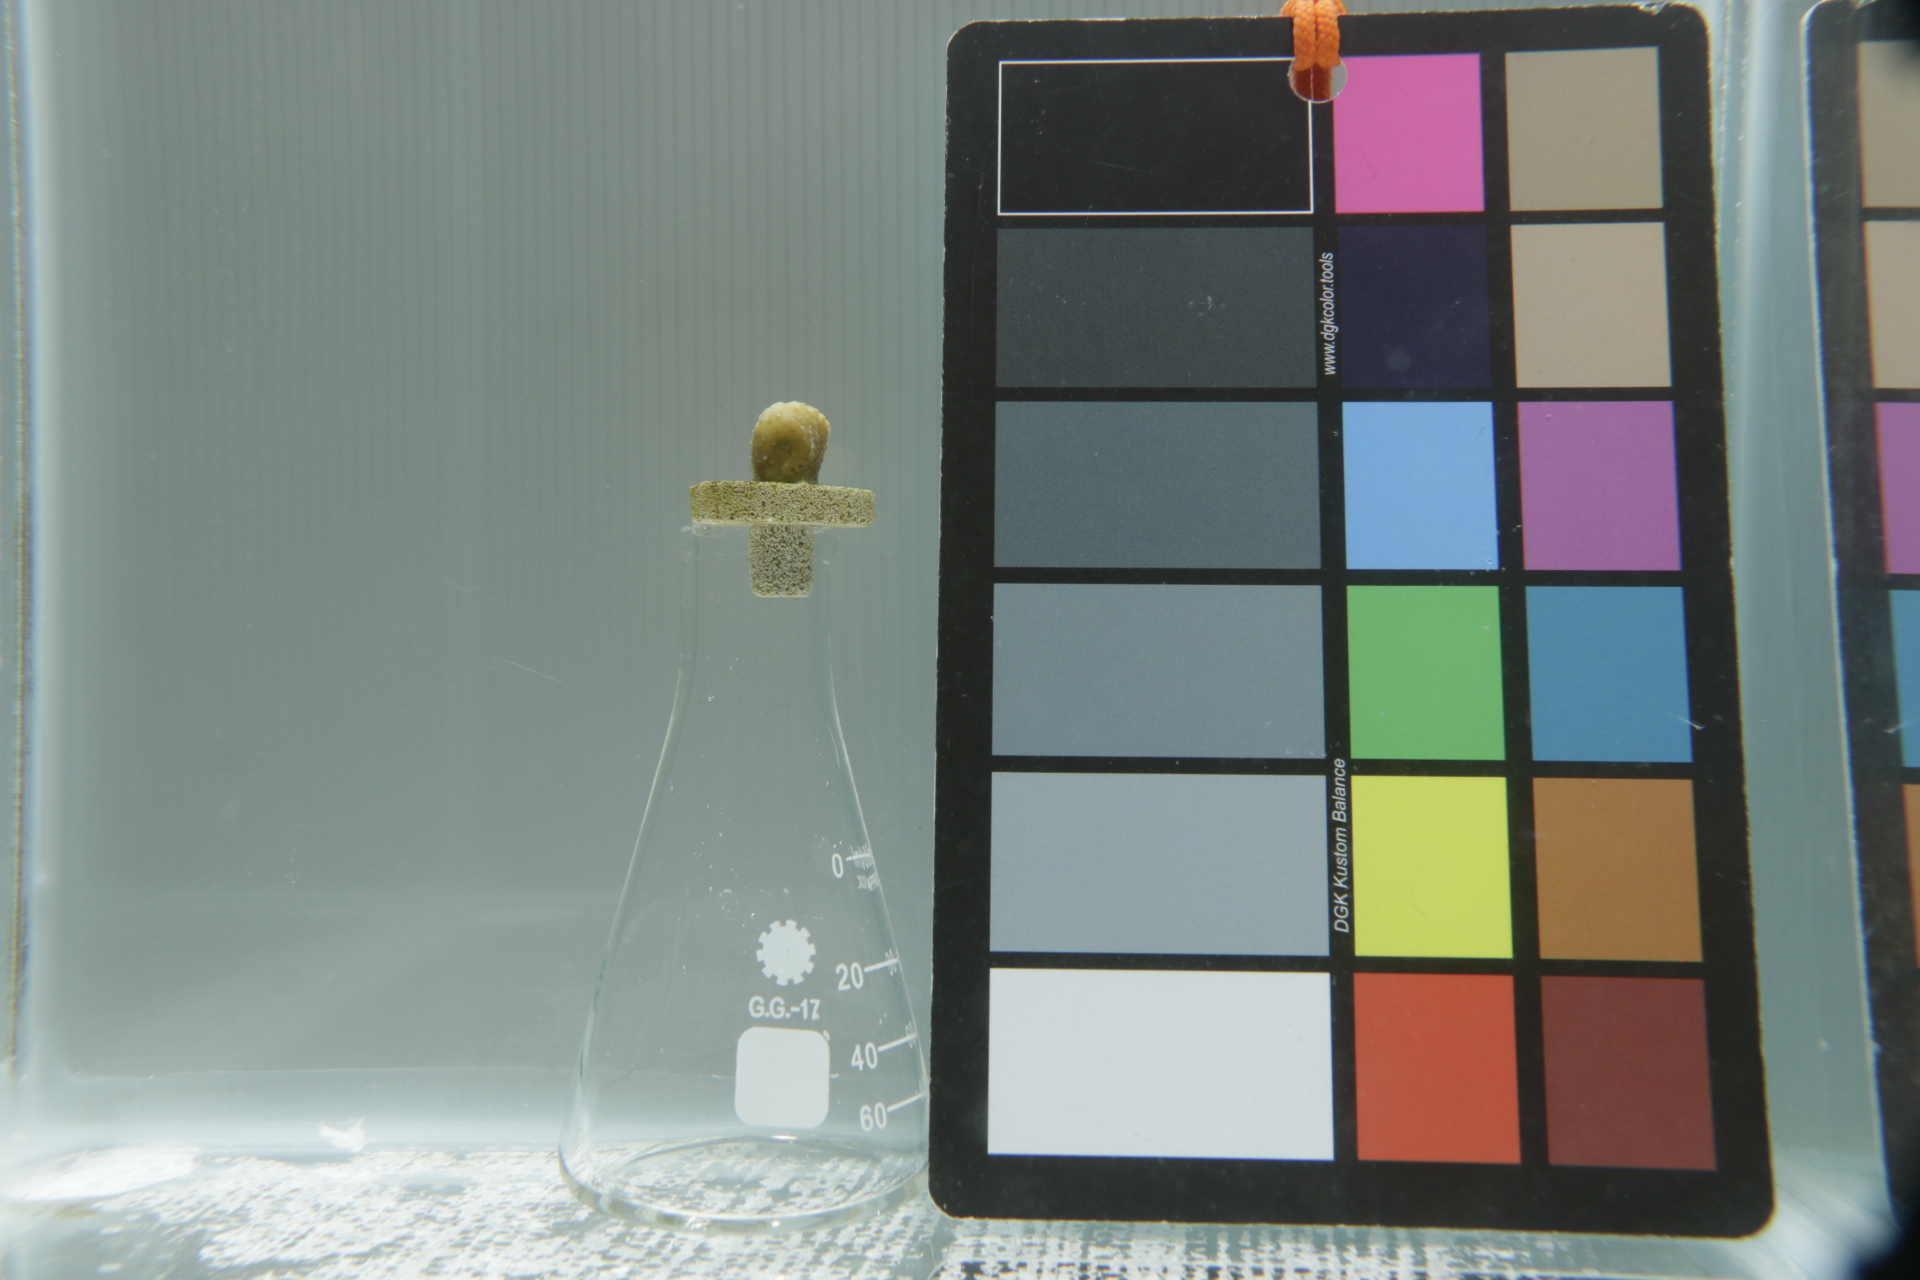 Figure 22: Nub S1-3 image three.
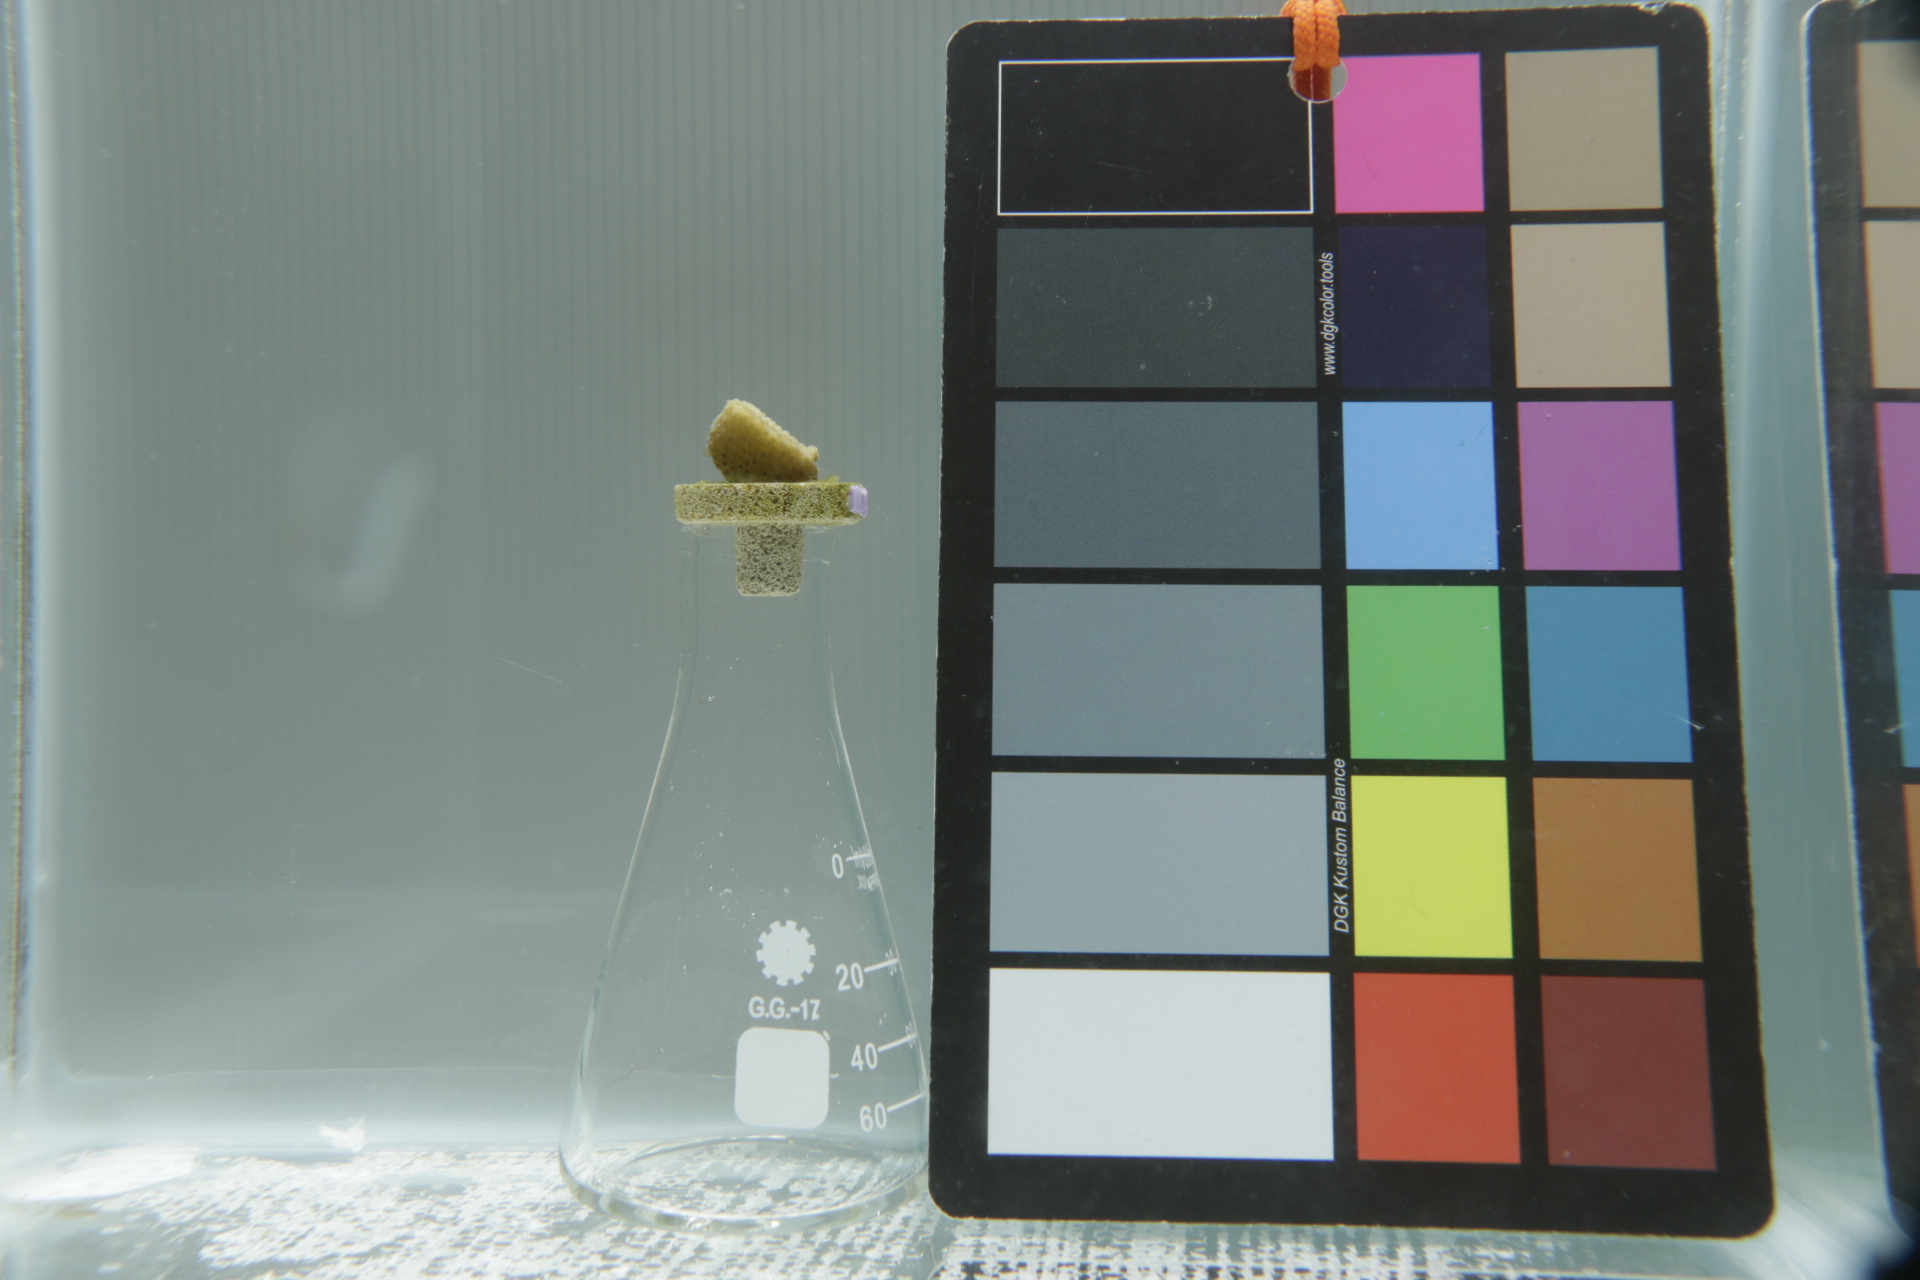 Figure 23: Nub S1-3 image four.
Imaging rig V6 - Side Lighting and new background tests
For this version of the lighting rig, I tested out using two lights with one on each side instead of one light above. Additionally, I noticed that the white background I was using before had lines that would interfere with segmentation, so I swapped it for a plasterboard white background that didn’t have lines, thinking this might improve the result.
36 images were taken with the new white background. I also tested out using a black background with a few different coral nubs (4 images). Overall, the best results were from the black background with side lighting.
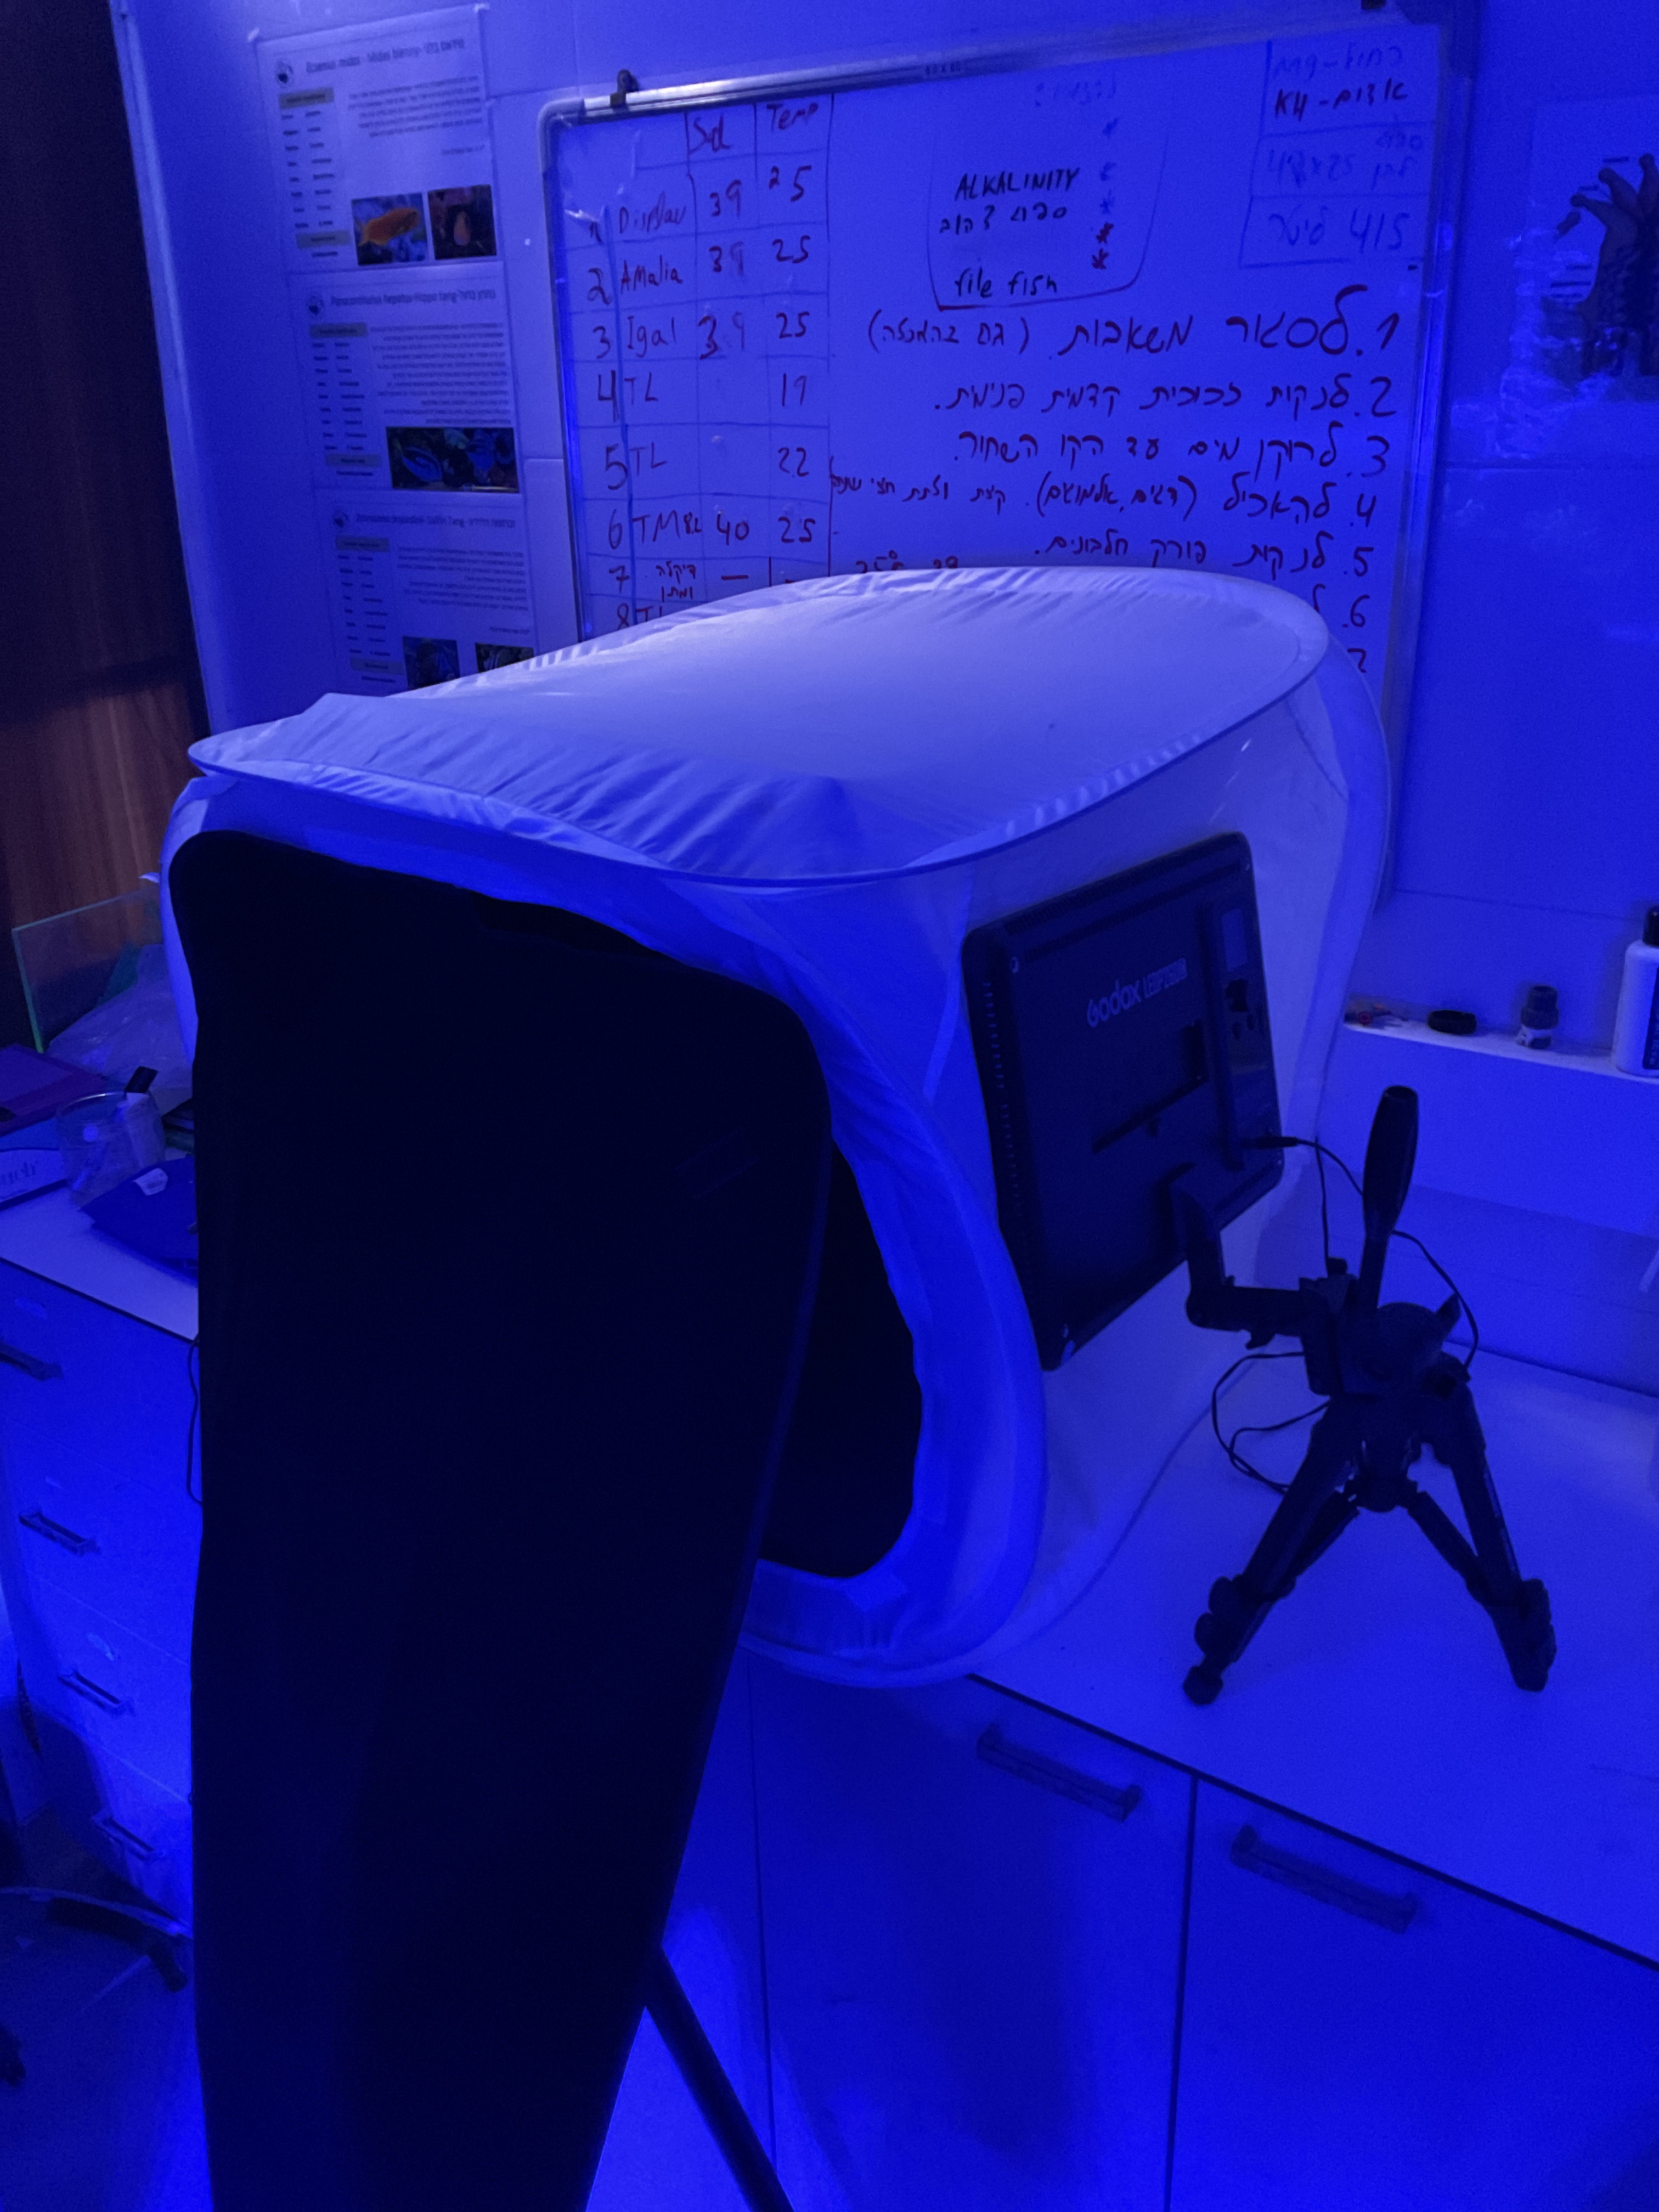 Figure 24: Imaging rig V6. two lights were used, one on each side. The lights are not turned on in this photo.
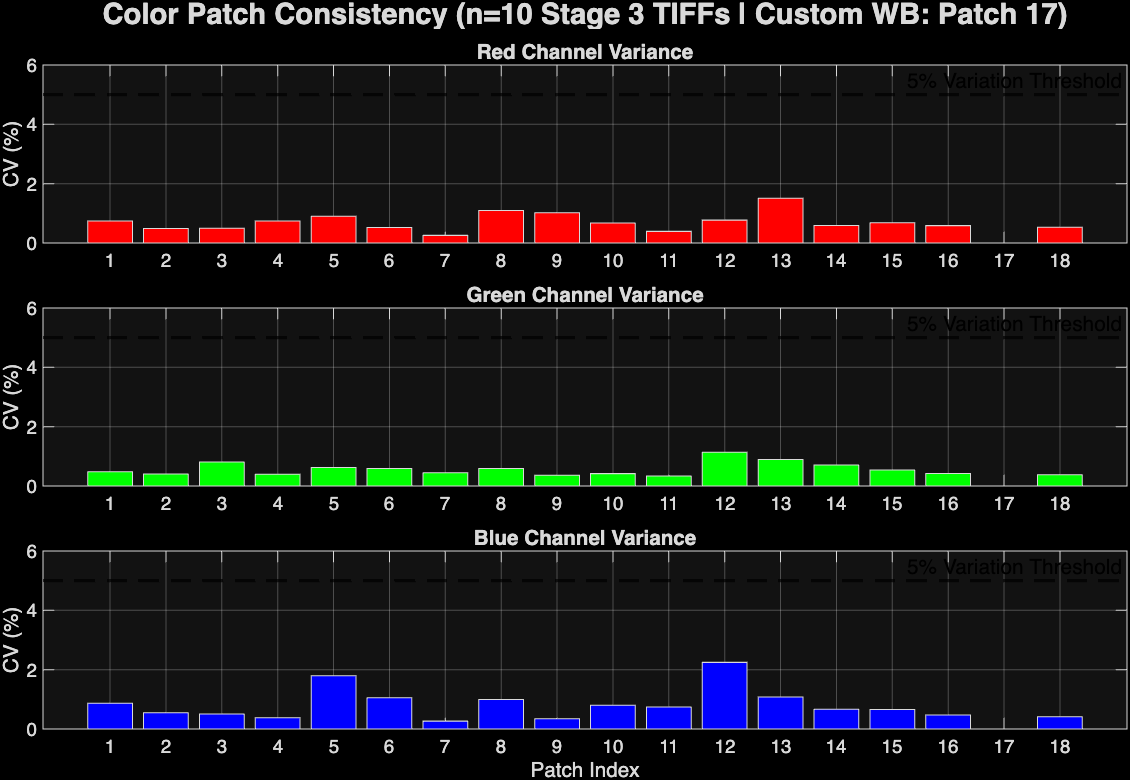 Figure 25: Color patch chromaticity consistency with side lighting.
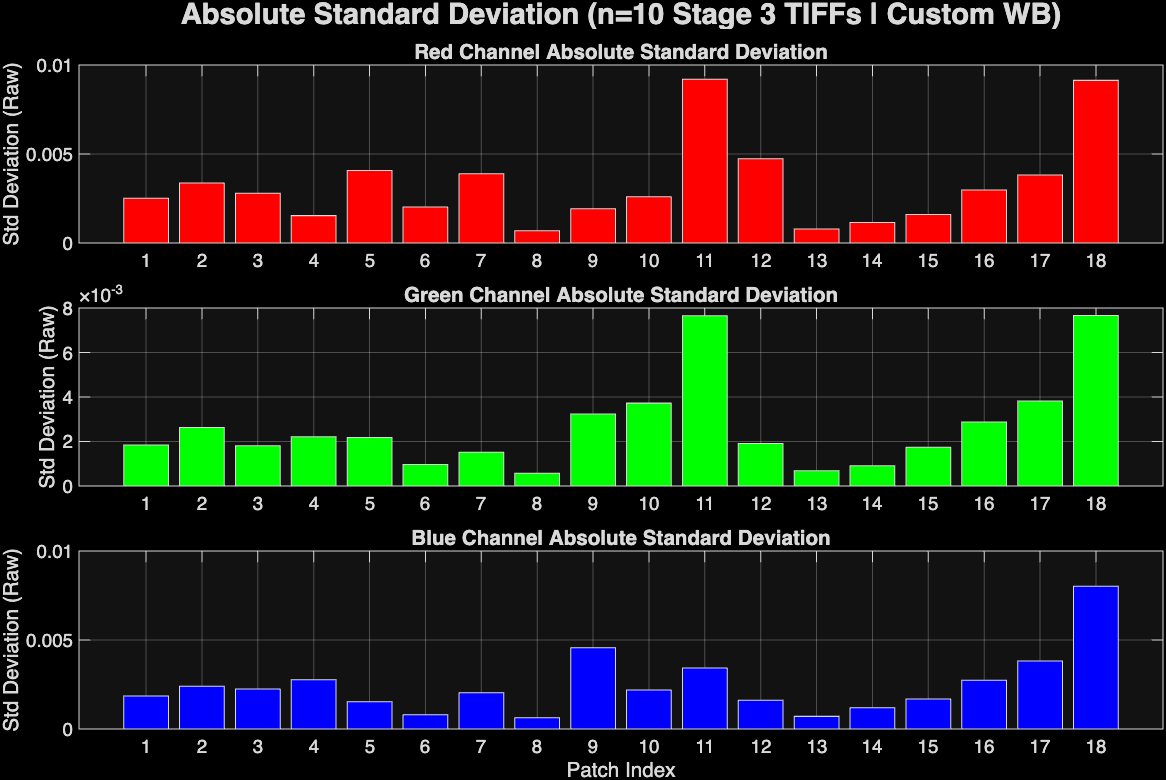 Figure 26: Color patch standard deviation values.
In the following images (Figure 27a-27d), you can observe the differences between overhead lighting and side lighting. The side lighting produces more uniform lighting with less shadows on the undersides of the corals.
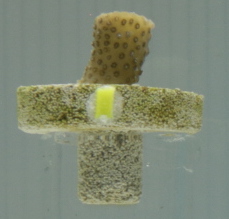 Figure 27a: Overhead lighting of nub S2-1.
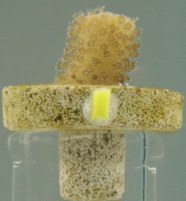 Figure 27b: Side lighting of nub S2-1.
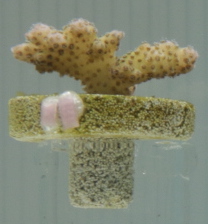 Figure 27c: Overhead lighting of nub P2-2.
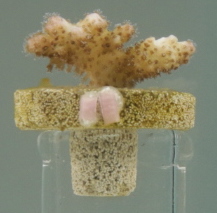 Figure 27d: Sidelighting of nub P2-2.
In the following images, you can see the differences in the background material used. In 28a, you can see the white background with lines, 28b shows the white background without lines, and in 28c you can see the impact of using a black background. Since corals turn white when bleached, the black background makes it easier to separate the bleached coral pixels from the background.
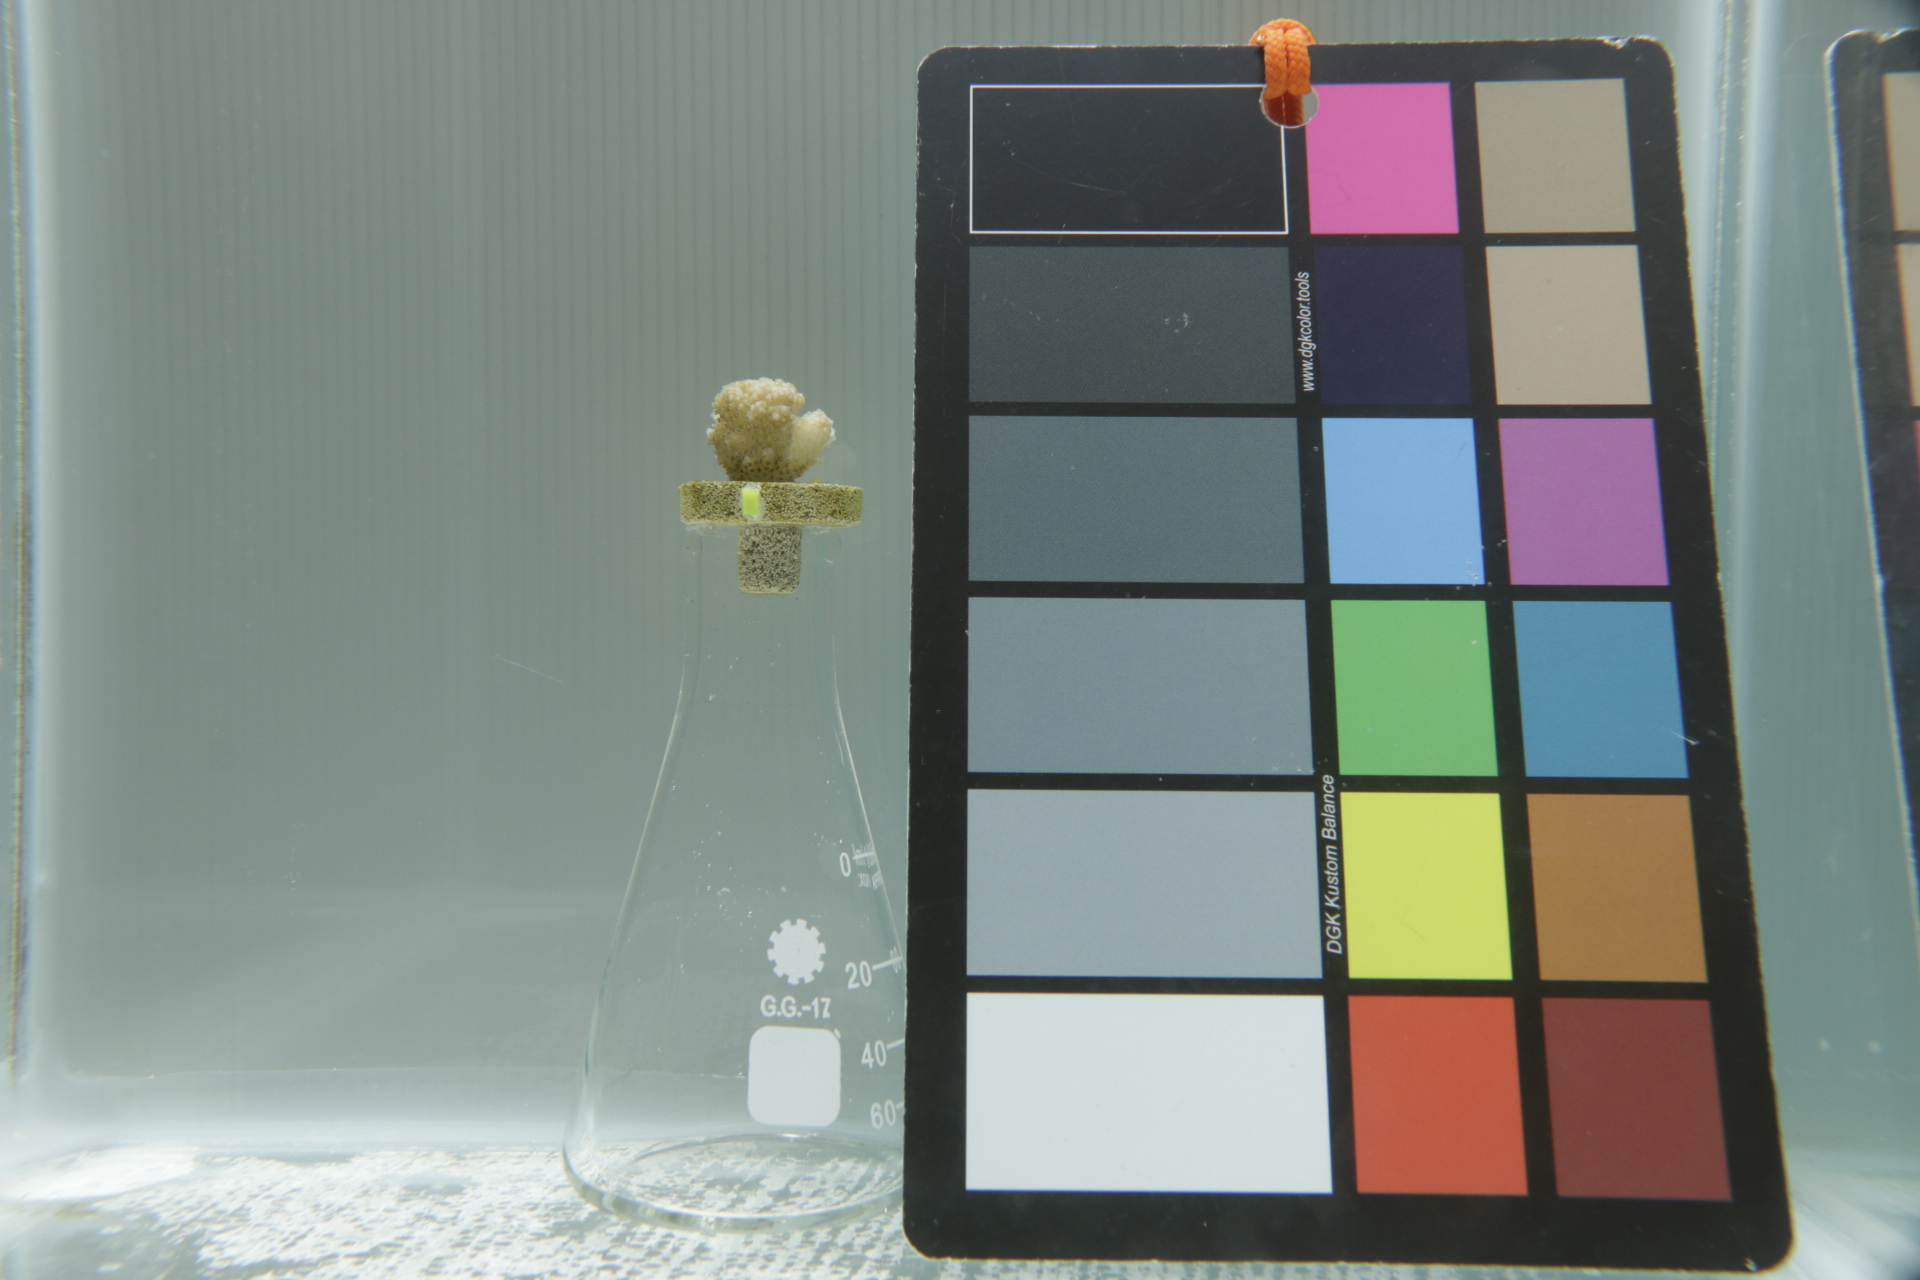 Figure 28a: Bleached coral nub on the white background with lines (overhead lighting).
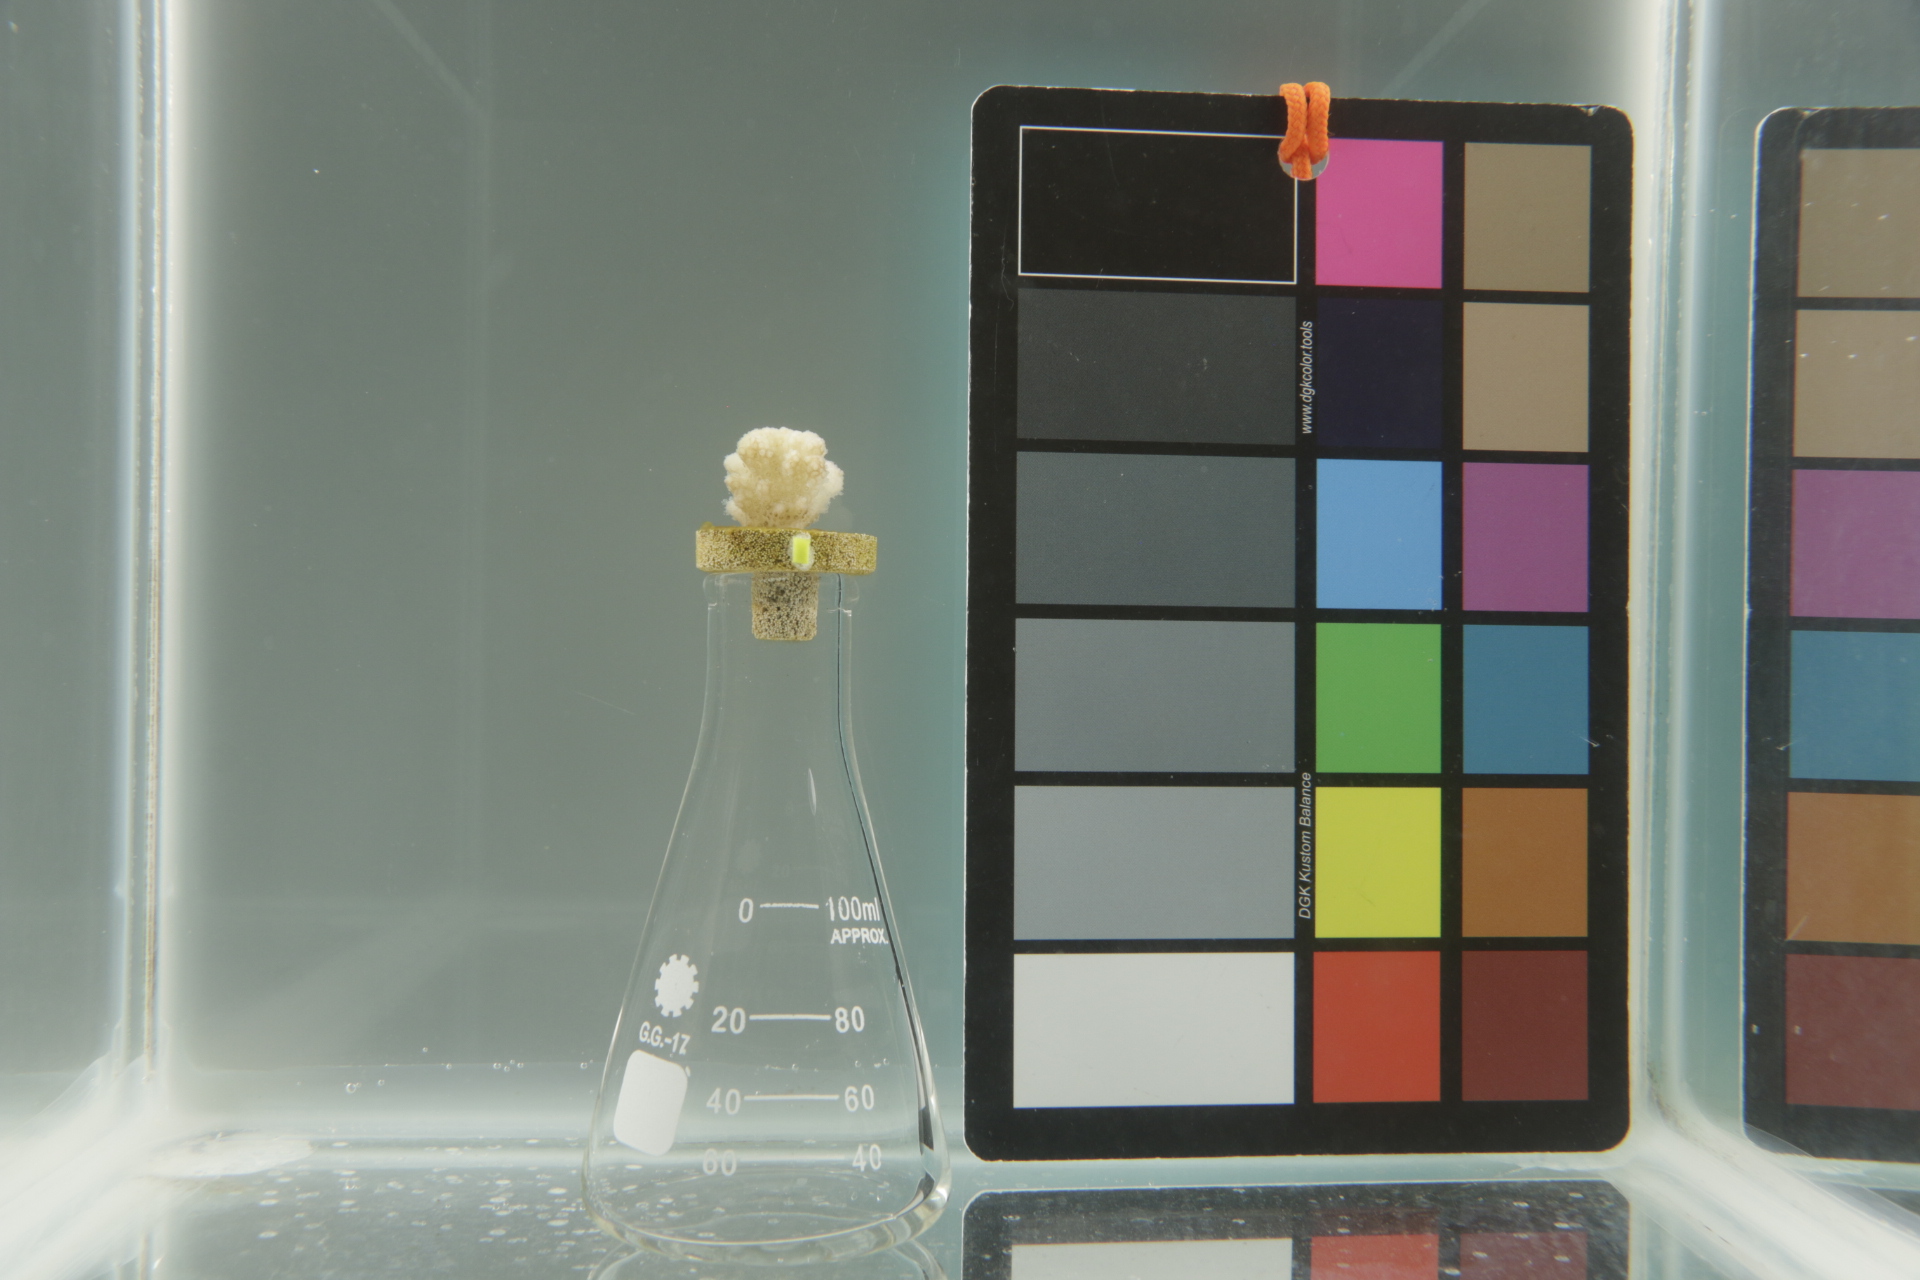 Figure 28b: Bleached coral on white background without lines (side lighting).
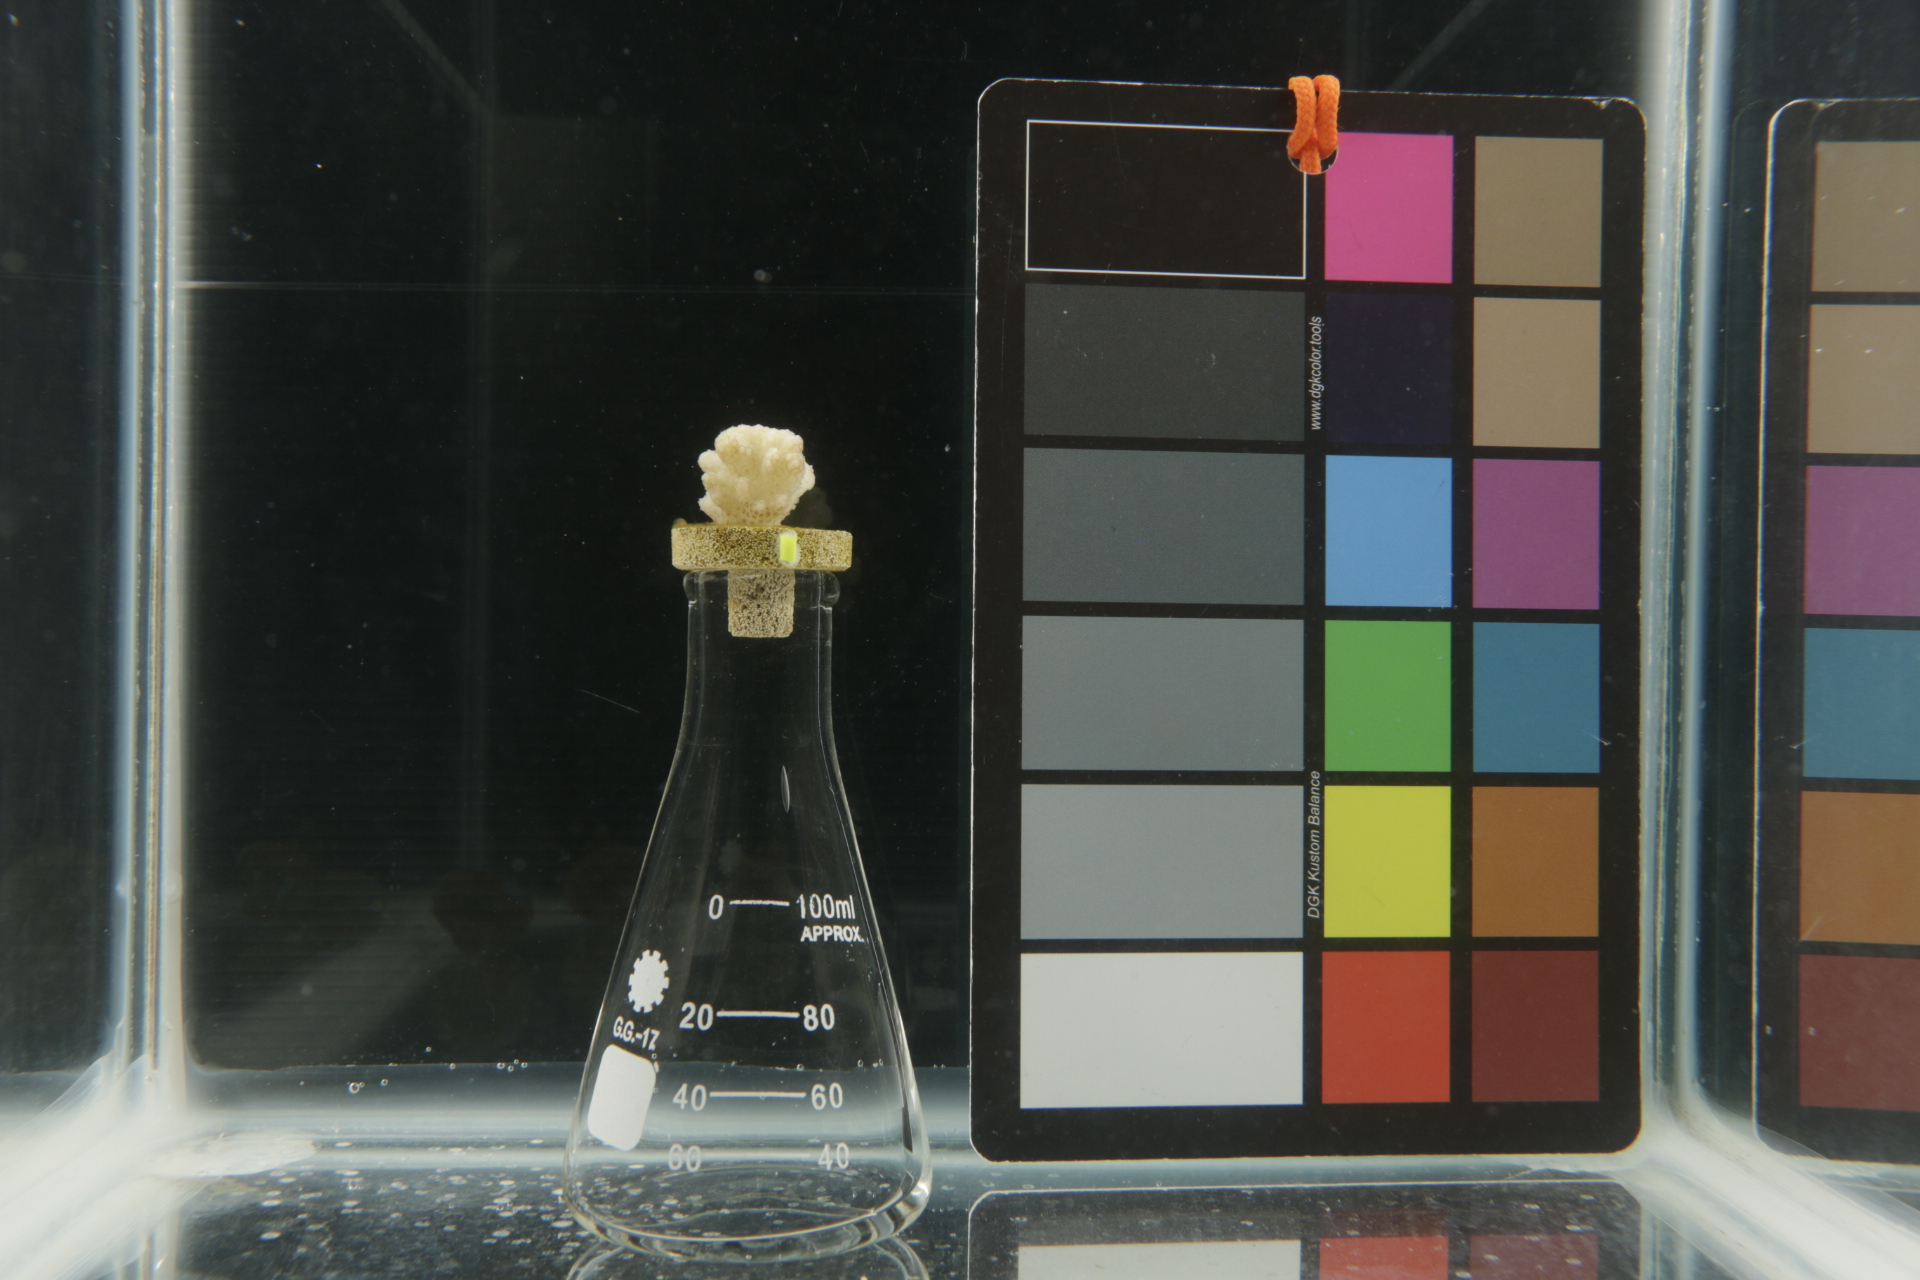 Figure 28c: Bleached coral on black background (side lighting).